I was fairly certain that there were going to be a whole host of updates and additions to Power BI, and I can say that I am not disappointed. There is a whole host of information below, where I will endeavour to try and get it all to you, so this might be a bit long to read, but it will be worth it.
Power BI – June Desktop Update
First off is another big update to Power BI Desktop and as I do every month I will highlight the new features.
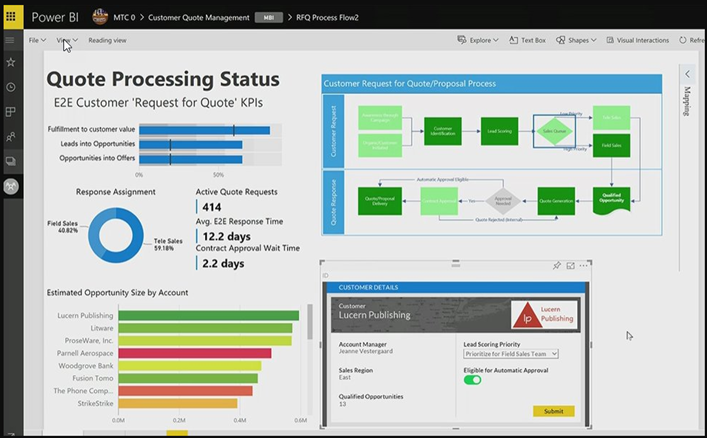
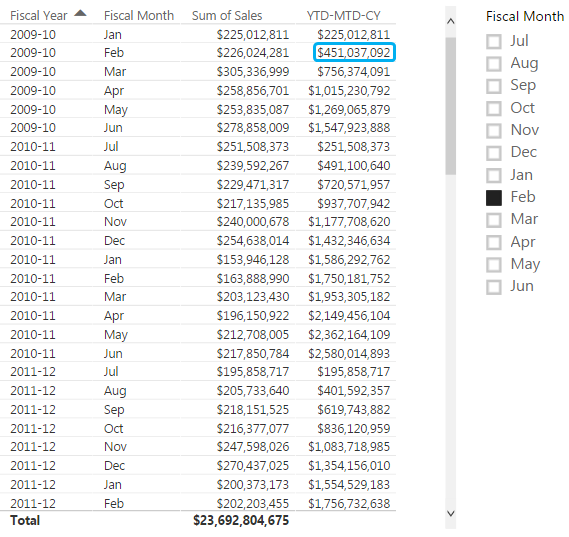
Report View
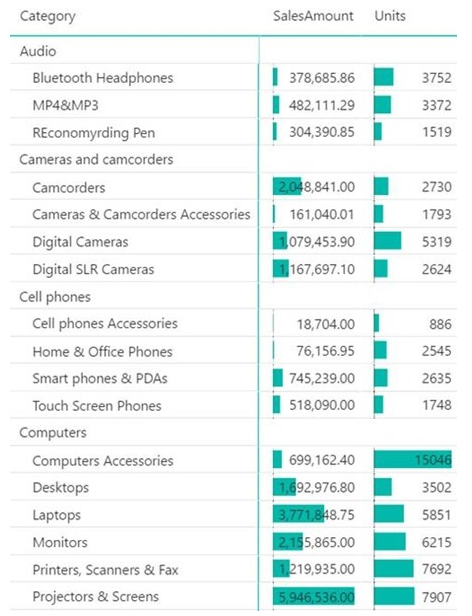
As with the image above you now can add in data bars for tables and matrixes, this is really handy and as they are continuing to do, is to add in Excel like functionality into Power BI
Next is the ability to add in Line Markers for your charts. Which can make it visually easier to see, but as they mention also easier for color blind people. A thing to note is that currently (June 2017) it is limited to Categorical Axis, and the Continuous Axis will be coming in a later release.

You can now also change the fonts in the formatting pane for your charts in the following area’s below (The rest of the area’s will be added in future releases)
- Axis Labels
- Axis Titles
- Legend Values
- Data labels
- Every section of the new Table and matrix visuals
- Slicer header and items

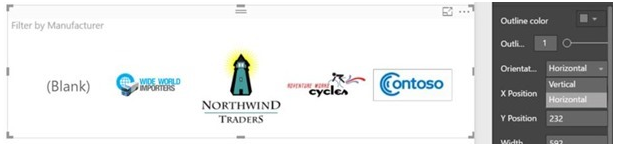
They have also now enabled the ability to use a Horizontal Image slicer to your report. This makes it easier and more flexible so that you can now use this in your report as required.
You can now use the Combo chart to align the zeros in your data, as well as shading so that it all aligns to show the data as accurately as possible.

It is nice to see that you now also have got some updates to the Bing maps being used in Power BI, as well as they are going to leverage the new Bing API which is going to be released at the end of June.

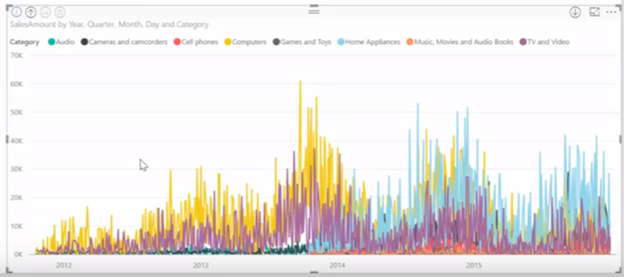
Also in this update there is now a new algorithm for high density line sampling, I know in the past that Power BI has been called out that it cannot sample enough data points, so now the Power BI team has updated the algorithm so that it now will take each point, and put it into bins, and then takes the min and max which it will then plot into the data. This ensures that you will not only get a more accurate visual representation of your data. But you will also get to see the outliers.
Note that the new High Density Sampling option is enabled by default.
The last part for the reporting update is that there now is the ability to be able to create Accessible Reports. They are starting with using Keyboard navigation and as well as you can now add Alt Text to all the visuals, so that when people who require accessibility options there will be some additional text for them to understand what the chart is telling them. The Alt Text will be read out by the accessibility options.
Data Connectivity
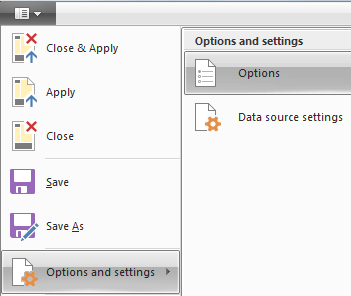
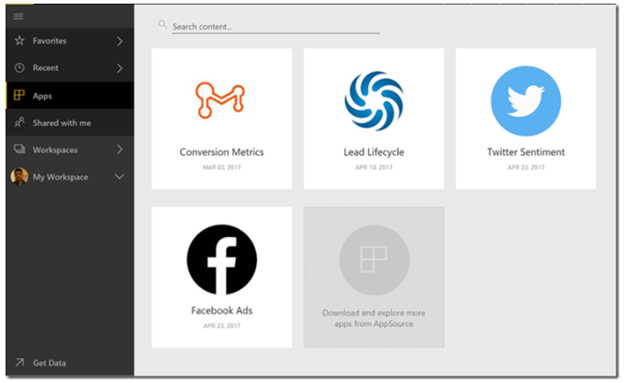
With the previous months release of custom data connectors. They have now enabled it as a preview feature so that it can now appear under the Get Data when you open Power BI Desktop.

They have also released the following new data connectors
- Power BI service Live Connect to On Premises and Push streaming datasets
- Impala connector is now generally available
- Amazon Redshift connector is now generally available
- SAP BW connector – DirectQuery support (beta)
- IBM Netezza connector (beta)
Query Editing
They have updated the “Add Columns from Examples” so that it now is giving you multiple suggestions for what you are trying to achieve. I personally think that this in incredible because it now means you can choose which one you want to use when you can have more than one outcome.

You can find the blog post from Microsoft here: Power BI Desktop June Feature Summary
Data Insights Summit Details
With the Microsoft Data Insights Summit that is currently happening in Seattle the Power BI team has been really busy letting us know what features are coming and what to get excited about in the coming months, so below is a quick overview of what has been released.
What is coming
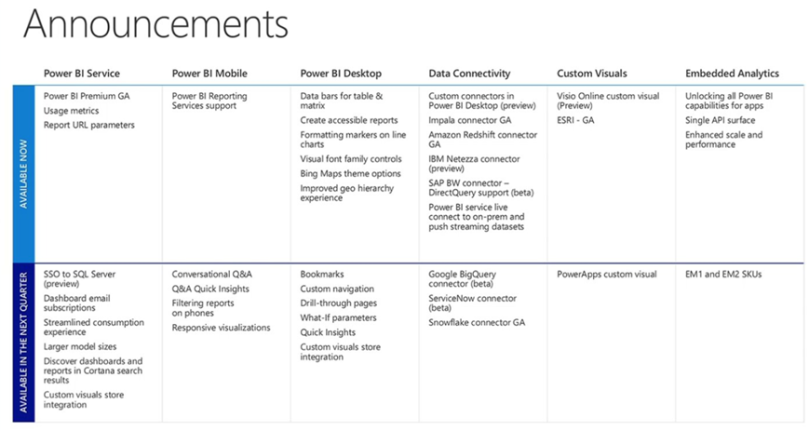
As you can see below there are a whole host of details around what is now available and what will be completed in the next quarter.

Drill through Pages
This is one of the announcements that have created quite a bit of excitement, in that very soon you will have the capability to be able to drill through to other pages. But not only that when you do drill through it will remember what you selected or filtered and use this on your drill through page. So now you can drill through, as well as go back to your previous page.
I personally have been asked about this before and I know that it is something that people have been waiting for. As well as this can make the entire reporting experience a lot better and interactive.

What-If Analysis
This is a really amazing feature in that you can quickly and easily create a What-If scenario and then use this within your data to see how it will be affected.

Bookmarks
Another new feature which will be released soon is the capability to create bookmarks. You can then use the bookmarks to do story telling with your data. And you can enhance the bookmarks that you have saved, so that you can make things pop out or highlight certain aspects.
What I really am excited about is that you can still interact with your data in your bookmark. So it is totally interactive, and as they say this is the Power Point for Data Insights.

M Language
As you can see below M language is going to have more integration with Office products, as well as versioning & dependency tracking for extensions which appears to be to have version control!

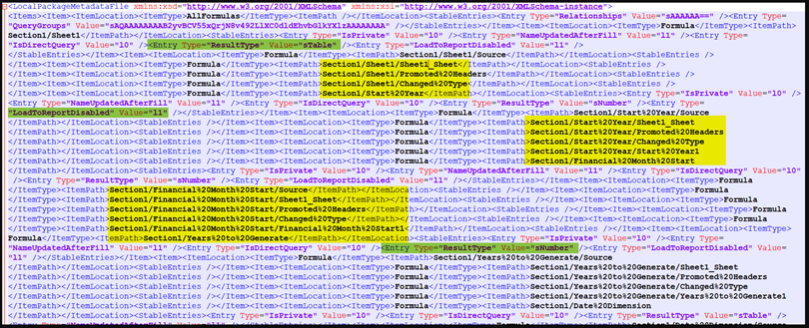
Power BI Desktop Version Control
You can use OneDrive for Business to ensure that you have got version control for your Power BI Desktop files

Organizational Folders
It appears that you will now be able to organize your folders as you could previously do with SSAS OLAP

Power BI Write back with Power Apps and Visio Custom Visual
This is a big one, where they have now used Power Apps in order to facilitate a write back of your data into your Existing Power BI Model. This is something that people have been asking for, for a long time.
As well as now you can also integrate Visio visuals into your Power BI report, and if you create your Visio visuals with ID’s you can map these to your data so that they will interact as you can currently do with all other visuals within your report canvas.

Azure Analysis Web Designer
There is a preview coming where you can now design and tune Azure Analysis Services from within your Web Browser.
The things to take a note of is that you can import Power BI Desktop files which will be converted into Azure Analysis Services, which means you can create a proof of concept locally and then enable it to be used for the enterprise.
As well as then integrate these datasets with Power BI, Excel, Visual Studio and GitHub, so if you are looking for more source control around your development this might be the option going forward.

Power BI Embedded Pricing & Explanations

There now is a white paper in which they explain how to leverage Power BI Embedded with Power BI Premium. As well as also detail what the pricing is and also explain how page renders work, which is important for when deciding which size to go for.
Here is what the pricing points are below.
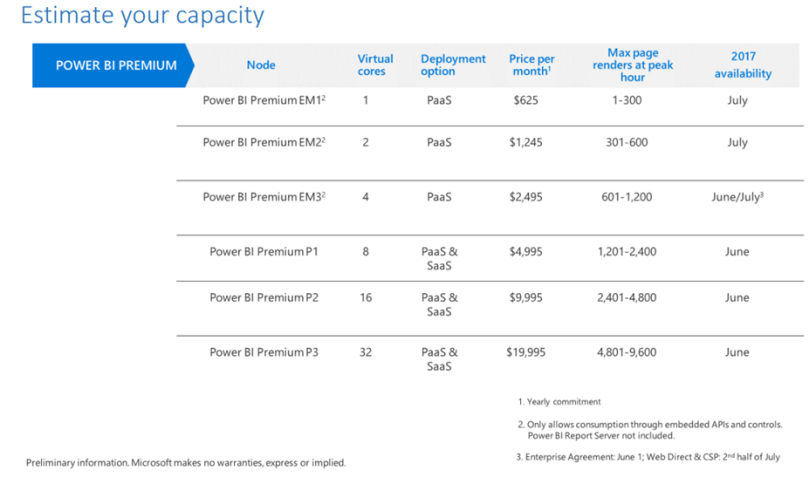
You can download the White paper from the following location: Plan capacity for embedded analytics with Power BI Premium
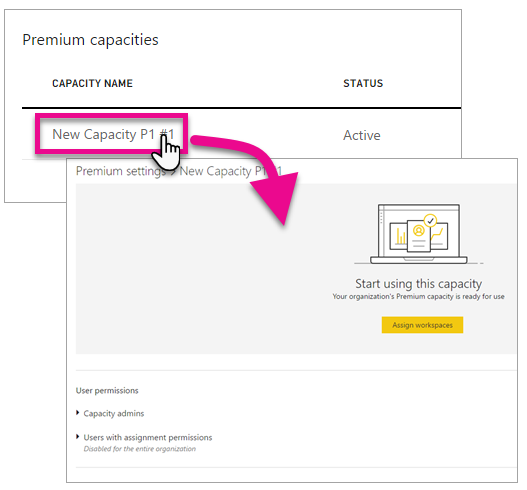
Power BI – Premium Generally Available
Power BI Premium is now generally available, so organizations who are looking to leverage the capacity or to significantly save on licensing costs can now purchase Power BI Premium.
You can get more details here: Power BI Premium
Here is also some additional documentation around Power BI Premium:
Power BI – Power BI Report Server Generally Available

As you can see from above, which they also announced at the Microsoft Data Insights Summit, Power BI Report Server is now Generally Available. This is great news for people who are going to purchase Power BI Premium, or they have the correct SQL Server Licensing model to install this.
You can find the details here: Power BI Report Server now generally available