BI-NSIGHT – Power BI (Mobile App Update, Waffle Chart Visual, Alpine Metrics Content Pack, KPI Indicator Visual Explained) – SQL Server 2016 (Hear from the Engineers, Virtual Lab, KPI Data Refresh) – Excel 2016 (New Functions, Power Query Update)

There has been a lot happening in the BI space over the past week. Loads of things to read about and review and see how this can be integrated and used.

So without any further delay let’s get into the details.

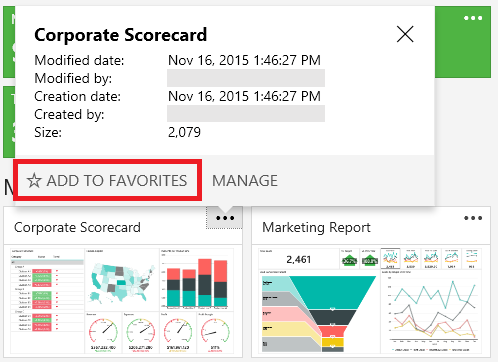
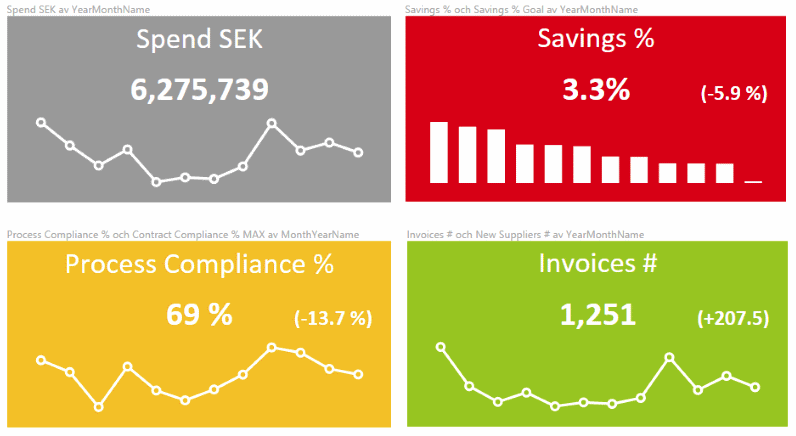
Power BI – Mobile App Update

They have made some great improvements to the Mobile App, currently only for Windows 10 and iPhone. I have no doubt that the Android version will be updating soon enough.

What this update allows you to do is to open up the reports from the dashboard view. I do think that this is something that has been lacking. As often you want more details or to understand why the value is up or down. And by having this capability it means that now the information is literally at your fingertips.

You can find out the details here: Power BI Mobile Apps – Open your reports on your phone

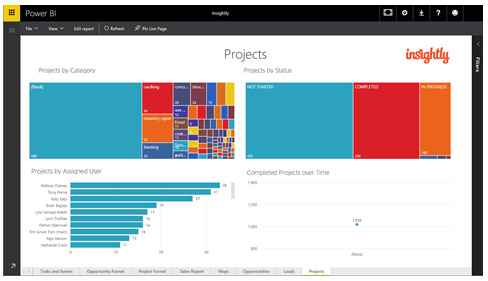
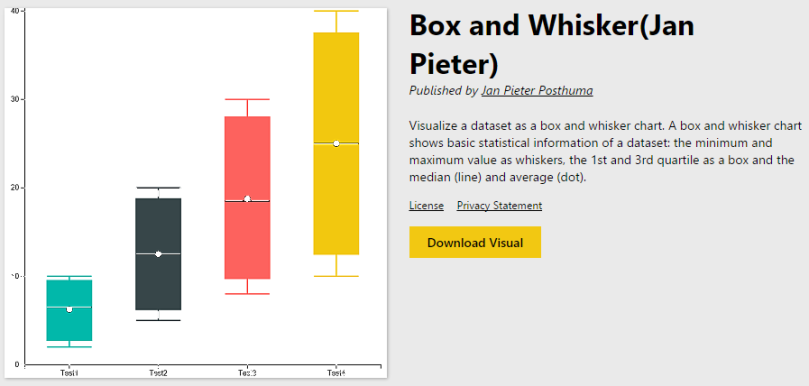
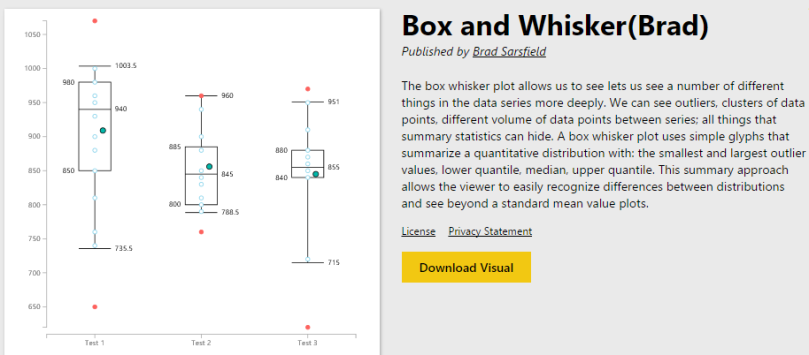
Power BI – Waffle Chart

I honestly just am amazed at how they keep on creating ever better and more intuitive visuals. I personally have never used the Pie Chart, because it does not give the end user the right information. Now there is another option to use the Waffle chart, which can give you some context to show the comparison.

You can find out all the details here: Visual Awesomeness Unlocked – Waffle Chart

Power BI – Alpine Metrics Content Pack

Yet another great content pack if you are a customer of Alpine Metrics. And it does appear that they are using Cortana Analytics to enrich their data and get their predictions as close as possible. Which is really amazing to see?

To be honest who would not want to get a prediction on their information that they can use to possibly increase their sales.

You can find more information here: Predict Sales With Alpine Metrics Data and Power BI

Power BI – KPI Indicator Visual Explained

It is great to see that the creating of this amazing KPI Indicator has created a blog post to explain exactly how to use all the features and configurations that are part of his awesome visual.

To be honest I did quickly look at in the past, and I did not spend enough time looking at all the configurations and thought that there was quite a lot going on, and not a lot of information around who exactly to get the configuration you desire.

Now with the blog post from Fredrik below, you can understand how to configure it to get your required outcome.

You can read up about Fredrik’s blog post here: KPI Indicator custom visual for Power BI explained

SQL Server 2016 – Hear from the Engineers

What this event is, is where you can now hear from the engineers at Microsoft and see what and how they have achieved the great improvements and new additions in SQL Server 2016.

There is not a lot of details but it does look like we can get some great insights in the Hybrid BI area.

You can find out all the information and register with the blog post below.

Your invitation to be among the first to hear from SQL Server 2016 engineers

SQL Server 2016 – Virtual Labs

It is great to see that there is now a virtual lab that you can use and test using SQL Server 2016 SSRS for Mobile. This gives you a quick and easy way to test and see how you can leverage SQL Server 2016 to create amazing mobile reports.

I do think that this is a great start to learning and getting your hands into the technology. As well as not having to install or configure anything.

You can find out about how to use the Virtual Labs here: Try SQL Server 2016 Reporting Services with new TechNet Virtual Labs

SQL Server 2016- KPI Data Refresh

This is a great blog post from Patrick where he explains very easily how to enable your KPI to be refreshed on a schedule.

You can find the details here: Refreshing KPI Data in SSRS 2016

Excel 2016 – New Functions

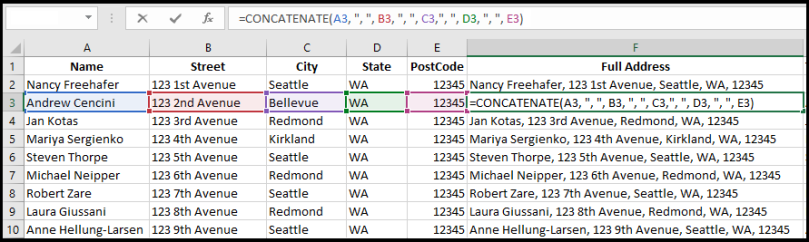
It is great to see that they are expanding Excel with new functions, which makes it even easier to get the data in a format that you require to gain the best insights.

I do think that the Concatenate, TextJoin, IFS and Switch functions will make it a lot easier. And I have no doubt that going forward there will be more functions coming from the Office Excel team.

You can find the details here: 6 new Excel functions that simplify your formula editing experience

Excel – Power Query Update

It is great to see that Power Query for Excel is getting an update. I do feel that a lot of the effort and time for Power Query has gone into the Power BI Desktop version.

You can download it from here: Microsoft Power Query for Excel

BI-NSIGHT – Power BI (Contest Winners, Perks for Community, Mekko Visual, Insightly Content Pack, Zuora Content Pack)

In the past week there have been some great additions to Power BI. As well as some great perks for people who participate in the Power BI Community.

So let’s see what we have in this week’s BI-NSIGHT

Power BI – Content Winners

I have to say that all the people that made it through to be voted for the contest really came up with some interesting idea’s. And it was great to see how you can leverage Power BI in so many different ways.

I definitely agree with the Winner and the Runner up, they did an amazing job and looked amazing.

You can read all about the Contest Winners here: Meet the Winners of the Best Report Contest

Power BI – Perks for the Community

I have to admit that I really think that this is a great incentive from Microsoft and the Power BI team. As I have mentioned in the past one of the reasons that I really enjoy working in the Microsoft space is the community that you become a part of. Where people help other people expecting nothing in return!

And it is great to see that when you go and help other people there is a small reward for all your efforts.

And the first of this will be at the Microsoft Data Insights Summit, so for those attending read all the details in the link below.

I do think that this new Summit will be a must go to in the future especially as Power BI is really becoming a Business Intelligence force to be reckoned with. As well as I have no doubt that just working in the Power BI space could easily become a full time position.

Just one a side note if anyone is interested in an online community I am part of the Facebook group called World of Power BI, which is where we are looking to bring the community to the Facebook platform. So if you are interested please go and have a look or join!

Read about the Community Perks here: Exclusive Perks for Community Members!

Power BI – Mekko Visual

I have to say that I am already using this visual, it is really easy to use and is another great way to visualize your data in a really unique way. I can see a lot of uses for this due to the fact that it combines the 100% stacked column chart and the 100% stacked bar chart.

As with the example above you can easily see which car manufacturer dominates which car area.

You can find out all the details here: Visual Awesomeness Unlocked – Mekko chart

Power BI – Insightly Content Pack

This content pack is great for existing Insightly customers in the CRM and project management space. It allows them to gain insights into their data. Which in turn can enable their business to be more efficient.

You can find our more details here: Visualize your Insightly CRM data with Power BI

Power BI – Zuora Content Pack

Yet another content pack, but this time it is for Zuora which is the world’s largest provider of Relationship Business Management Services.

So if you are an existing customer you can understand what is happening within your engagements and ensure that you can extend the long-term relationships which is one of the goals of Zuora.

You can find out more information here: Analyze and Monitor your Zuora data in Power BI

BI-NSIGHT – Power BI (Service Update, External Sharing, Admin Portal, Web & Video Widget, Zooming) – SQL Server 2016 (Mobile Publisher Preview 2)

This week has been another great week, with some great service updates in the Power BI space, as well as another release for SQL Server 2016 mobile reporting!

Power BI – February Service Update

There have once again been a whole host of Service updates to Power BI. And as per my previous blog posts I will touch on the ones that are most relevant.

Below is a list of all the Service Updates

Sharing

  • Admin Portal

  • Quick Insights

  • Dashboard

  • Connectivity

  • One of the most common features was the ability to share your dashboards with external people. It is great to see that Microsoft have released this functionality. I have no doubt that this was part of the embedding of the code into a Web Page.

    I am sure that this will be used by a lot of people, so that they can send it to customers or people who are part of the company or business or on a contract.

    One thing to note is that if you use the Power BI Pro features, then the people who you share it with externally will also have to have the same license.

    It is great to see that there now is an admin portal (If you have got the correct permissions), due to as the size and complexity of Power BI grows, there is the need to manage what people can do. And as they said this is the first iteration of the admin portal. I have no doubt that there will be a whole host of additional items added into the admin portal.

    The quick insights is a great feature because I often think not everyone will have the actual insights to create amazing dashboards. But along with this, even though it is an automated process it might give you insights into your data which you never thought about in that way before. So I think that there is no harm in looking to what insights it gives to you.

    Under the widgets I always knew that this would be the start of things that can be embedded into Power BI. And this definitely gives some great features to enrich your dashboards. As often it does not all have to be only about data and visualizations. But also a video or other content to enrich what you are trying to portray.

    You can read more about it here: Power BI Service February Update

    SQL Server 2016 – Mobile Publisher Preview 2

    I personally know that we are going to be using the Mobile Report features in SQL Server 2016. And that in the past the Mobile publisher was a big buggy and did not do things that you expected it to do. Now with Microsoft having control of the Mobile publisher and their vast experience in development and testing I have no doubt that over time this will become an amazingly easy and simple place to author some great reports.

    I am looking forward to using the mobile publisher to see what amazing things I can create.

    You can find out more information here: Mobile Report Publisher Public Preview 2 now available!

BI-NSIGHT – Power BI (Publish in Web App, Enterprise Gateway GA, Desktop Update, Troux Content Pack, New Visuals) – SQL Server 2016 (CTP3.3, eBook, R)

So from last week to almost having nothing to talk about, to this week having a whole host of updates.

Just to quickly mention I attended the first local Power BI User Group meeting in Brisbane this evening ( QLD Power BI User Group ), and it had a really great turnout, along with some great content for the first user group. I have no doubt that it will grow from strength to strength.

So let’s get into the details there is a lot to cover here.

Power BI – Publish in Web App

This has been one of the most requested things that have been voted on. And it is great to see that they have listened again to what the people and users are asking for and have delivered it.

There are a few things to be aware of is that once you embed it into another application all your security is not valid.

Along with this currently due to it being in preview there might be an additional cost to have this capability. Which I can understand in a way because they are actually providing this outside of Power BI, and by making it available for anyone to interact, that means that there are things that are happening within the cloud that needs to be accounted for.

You can find out the details here: Announcing Power BI “publish to web” preview

Power BI – Enterprise Gateway General Availability

This is something that I have covered in the past, and it is great to see that they have incorporated all the features into one product.

This means it will make it easier to install, configure and get people using your on premise data. As you can see that this is something that I am already using and will be a great feature going forward.

Also the ability to handle failovers, as well as having the performance counter information will be great for viewing what is happening as well as the performance of the gateway.

You can find out the details here: Announcing General Availability of Power BI gateway for enterprise deployments

Power BI – January Desktop Update

This was announced last week, and there are a whole host of updates in the Power BI Desktop. I will go through a few ones here that I think are really important.

As you can see above, you can now add borders as well as Cartesian charts’ plot area.

Along with this, I really liked that you can now refresh data in individual tables, because sometimes in the past you did not want to refresh everything including your largest table.

And finally I see that they are still making performance improvements and cross rending is great. It has always been a fast visualization, but to make even that little bit faster means that everything will be that much quicker and who does not like speed?

You can find details here: Power BI Updates This Week: New Report Authoring Capabilities

Power BI – Troux Content Pack

This is yet another content pack, and if you are an existing Troux customer then I am sure that using Power BI will give you some great insights into your technology investments. Which will help you understand your data and how best you can leverage on your information.

You can find the details here: Explore your Troux data in Power BI

Power BI – New Custom Visuals

As you can see above there have been 3 new great visuals that have been released. And to me they are concentrated around mostly financials, which is great to see.

You can go here to see all the visuals: Power BI Custom Visuals

SQL Server 2016 – CTP 3.3

It was a surprise to see that they have released CTP 3.3 and most of the updates are around SSRS and SSAS Tabular.

It is great to see that now as per the visual above you can add your own favorite reports to your SSRS view of the world. Which I think is something that is so simple, but at the same time so valuable.

Along with this is the details and updates for SSAS Tabular.

It is really good to see that you can now create calculated columns in Direct Query mode. As well as applying Row Level security in Direct Query mode also. As I know personally in the past I did not implement Direct Query mode, due to the limitations, which now they have resolved.

It is good to see that they are adding a lot of updates and features for Business Intelligence to SQL Server 2016.

You can find details around SQL Server 2016 CTP3.3 here: Access your favorite KPIs and reports with SQL Server 2016 CTP 3.3

And then if you want to find out the details around SSAS Tabular you can find that here: What’s new for SQL Server 2016 Analysis Services in CTP3.3

SQL Server 2016 – eBook

This is an update from the original eBook, and there is a lot of great content in here, especially if you are not fully aware of what is coming in SQL Server 2016.

There are two versions for desktop and mobile.

You can find information about the eBook here: Free eBook: Introducing Microsoft SQL Server 2016: Mission-Critical Applications, Deeper Insights, Hyperscale Cloud, Preview 2

SQL Server 2016 – R


As you can see above R has come a long way, and is a great tool to use if you have the specific requirement.

The screenshot above was from a presentation by Jen Underwood. And there is some really valuable information in this slide deck.

If this is something of interest to you, you can view the slide deck here: Microsoft R Server and SQL Server R Services