BI-NSIGHT – Power BI (Desktop Update, Service Updates, API Updates, Mobile App Update, Visual Contest Results, Content Pack – Stripe) – Office 2016 (Excel Updates, Power Query Update, Excel Predictions) – SQL Server Analysis Service 2012 Tabular Update – SQL Server Analysis Services 2016 Extended Events

So this week there was once again a whole host of updates with Power BI, as well as finally the official release of Office 2016.

It sure is a busy time be in Business Intelligence space, especially in the Microsoft space.

So let’s get into it…

Power BI – Desktop Update

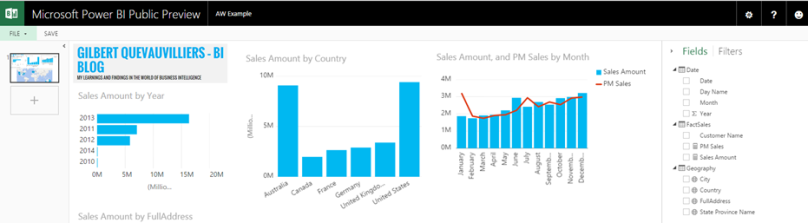
So I woke up this morning to see that there has been a massive release in the Power BI Desktop application. I immediately downloaded and installed the update. I have already used some of the features today.

And there was a whole host of updates, too many to go through all of them here, but I would just like to highlight the ones which I think are really great additional features.

I am really enjoying the Report Authoring features, and I have mentioned it before but the drill up and drill down features are really great and allows for more details to be in the report which you will not initially see on face value.

Then under the data modelling section I have to say that I am currently not any DAX guru, but I do appreciate how powerful it is, and how you can really extend your data with so many DAX functions. In particular is the Calculated Table, which Chris Webb has already blogged about and has some great information here: Calculated Tables In Power BI

And there are some great new features with regards to Data Connectivity as well as Data Transformations & Query Editor improvements, which all forms part of Power Query. Which once again enables the author of the reports to enrich the data, which in turn will create great visualizations.

You can find out all about all 44 updates here: 44 New Features in the Power BI Desktop September Update

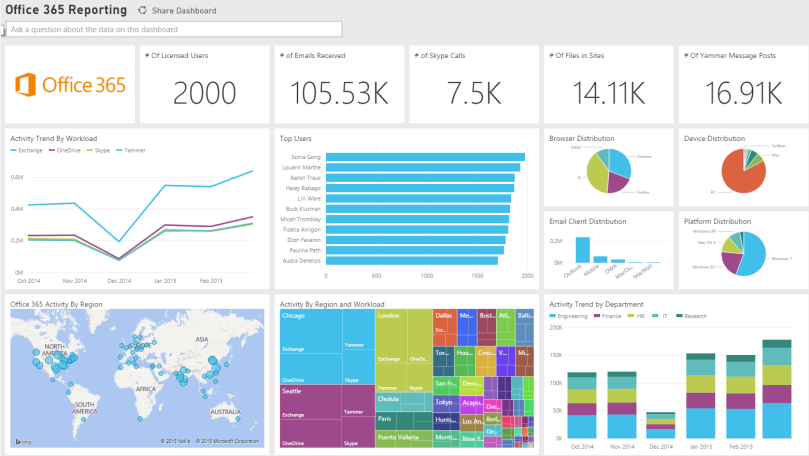
Power BI – Service Updates

So yet another great update on the Power BI platform.

I think that finally being able to customize the size of the tiles is really good. So that you can fit more meaningful information on your dashboard.

Another great service update is to be able to Share Read Only dashboards with other users. This is great because often you create dashboard and reports, which you want to share with users and let them interact with your data, but not make any changes.

As well as having more sample content packs which will be a great way to showcase how powerful Power BI is.

You can read about it and all other updates here: Power BI Weekly Service Update

Power BI – API Updates

There is no pretty picture for the API updates, but there are some great new features.

The one that I think is really good is the ability to be able to embed a Power BI tile into an application. So at least it gives you the ability to have the great features of Power BI in your application without having to go directly to Power BI.

I also see that there is the ability from what I can see to pass some filters or parameters into the Power BI report via the URL which is really good and can prove to extend the functionality.

These are the details in the API updates

  • Imports API
  • Dashboards API
  • Tiles and Tile API
  • Groups API
  • Integrating Tiles into Applications
  • Filtering Tiles integrated into your Application

You can find out all about it here: Power BI API updates roundup

Power BI – Another Mobile Update

The Microsoft team must be working 24 hours a day with the amounts of updates and additions that are coming out from Microsoft.

They have released some additional updates into the Mobile application which are great, as we all are well aware that having a mobile application really can help showcase your solution. As well as ensure that it gets to the right users and that they can see the related information.

You can find out about the updates to the IOS, Windows and Android details here: Power BI mobile Mid-September updates are here

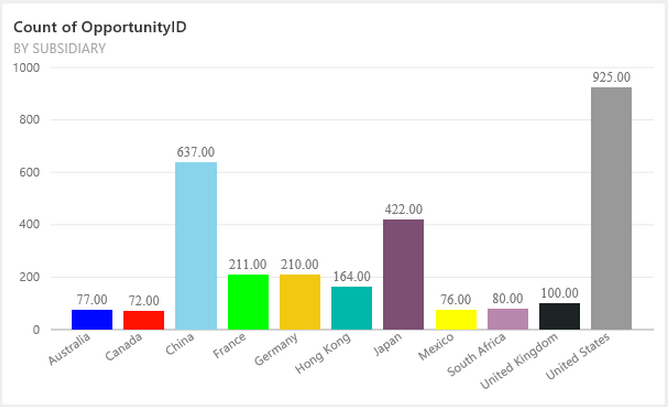
Power BI – Visual Contest Results – People’s Choice Awards

As you can see above this is the first people’s choice award for the Visual Contest result, which I can see myself using that with my existing data.

You can find out about it and the other entries here: Power BI Best Visual Contest – 1st People’s Choice Award!

Power BI – Content Pack Stripe

Once again this was another great content pack update this week.

There are a whole host of people who are using the Stripe platform payment for their online business. From the really small guys to the big guys. And this gives everyone a really great and easy way to understand and visualize your data. As well as what payments you are getting.

You can find out more about it here: Monitor and Explore your Stripe data in Power BI

Office 2016

I am very happy to see that Office 2016, has been released before the actual year of 2016.

I have mainly been focused on all the features in Excel, due to being in BI. But there are a whole host of updates, fixes and new additions in Office 2016.

You can read all about it and all the details here: The new Office is here

Excel 2016 – Features

With Office 2016 being released this blog post from the Office team shows a lot of the great features that are available in Excel 2016.

It does showcase a lot of great features focused on Business Analysts, as well as how people can leverage all the new features in Excel 2016.

You can read up all about it here: New ways to get the Excel business analytics features you need

Power Query Update

With so many things going on within Power BI, there has been another great release with Power Query.

As you can see with the picture above it is great to finally have the ability to write your own custom MDX or DAX query to get the data which you require from your SSAS source.

Another great feature is the ability to extract a query from one of the steps within your current Power Query query, and then you can use this in another Power Query window. As they say it gives you the ability really easily use the same code over again, without having to do it all over again.

You can read all about it here: Power Query for Excel September 2015 update

Excel Future Prediction

I recently came across a really interesting article from some of the Industry experts within the BI space, and for them to predict how they see Excel’s use as well as where they see it fitting into the BI space in the upcoming years.

There were some really insightful and interesting details, which made me think about how Excel has evolved over the years, and with the current additional investments going into Excel, how this is going to be leveraged and improved in the years to come.

You can read all about their thoughts here: 27 MICROSOFT EXCEL EXPERTS PREDICT THE FUTURE OF EXCEL IN BUSINESS INTELLIGENCE

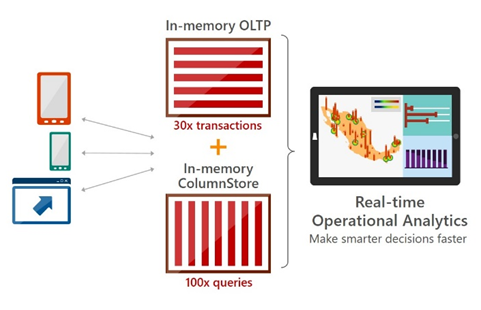
SQL Server Analysis Service 2012 – Tabular Update

There has been a CU update for SQL Server 2012, and one of the great updates relates to SSAS Tabular for columns that have a high cardinality. Which was a performance issue before this release.

It is great to see that this has been addressed, especially due to the fact that in SSAS Tabular there will be cases when columns will have a high cardinality. And even though it is often super quick, we would like everything to be as fast as possible.

You can read all about the updates to SQL Server CU 8 here: Cumulative update package 8 for SQL Server 2012

SQL Server Analysis Services 2016 – Extended Events

I think that it is great to see that we are finally getting some additional features and updates to Analysis Services.

When I read up about the extended events, this is something really great to see. I actually have been in an exercise to monitor what has been going on our SSAS instance both in terms of performance, as well as which users are accessing the cubes and what they are doing. And currently there is not a super elegant solution to achieve this.

With the extended events this makes it a lot easier and gives you the ability to quickly get the information that you require.

I also love it that you are able to have a live query, which you can use to see if you are specifically running something. As well as if you want to ensure that you are capturing the right events.

This is definitely something that I will be looking to use when we finally can install and use SQL 2016.

You can find out about all the details here: Using Extended Events with SQL Server Analysis Services 2016 CTP 2.3

BI-NSIGHT – SQL Server 2016 – Power BI Updates – Microsoft Azure Stack

Well I have to admit that it seems that the Microsoft machine has been working flat out to get out new products and updates.

If my memory serves me, this is the third week in a row that Microsoft has released new products and updates. I am really enjoying it! But hopefully this will slow down, so that we can catch our breath and actually play with some of the new products and features.

So let’s get into it. There is quite a lot to go over!!

SQL Server 2016

So with Microsoft Ignite happening this week, the wonderful guys from Microsoft have started to announce what we can expect to be in the next version of SQL Server.

I am going to focus mainly on the BI (Business Intelligence) features, and there are quite a few! Some of what I am detailing below I have only seen pictures on Twitter, or I have read about it. As well as the preview not even being released yet, I am sure that there will be some changes down the line.

SQL Server Reporting Services

It finally appears that Microsoft has been listening to our cries and requests for updates in SSRS (SQL Server Reporting Services)!

Built-in R Analytics

I think that this is really amazing, even though I am not a data scientist, I think it is a smart move my Microsoft to include this. What this means in my mind is that you can now get the data scientists to interact and test their R scripts against the data as it sits in the transactional environment. And from there, this could then be used to create amazing possibilities within SSRS.

Power Query included in SSRS

From what I have seen people tweeting about as well as what I have read, it would appear that Power Query will be included in SSRS. This is fantastic and will mean now that virtually any data source can be consumed into SSRS.

New Parameter Panel, chart types and design

I am sure we can all agree, that SSRS has required an overhaul for some time. And it seems that finally we are going to get this. It would appear that the parameters panel is going to be updated. I do hope that it will be more interactive and in a way react similar to the way the slicers do in Excel. As well as getting new chart types. Here again I am going to assume that it will be similar to what we have in Power BI!

And finally there was also mention that the reports will be rendered quicker, as well as having a better design. I also am hoping that they will deploy this using HTML 5, so that it can then be viewed natively on any device. It is going to be interesting to see what Microsoft will incorporate from their acquisition of Datazen.

SQL Server Engine

Built-in PolyBase

Once again, this is an amazing feature which I think has boundless potential. By putting this into the SQL Server Engine this means that it is a whole lot simpler to query unstructured data. Using TSQL to query this data means that for a lot of people who have invested time and effort into SQL Server, now can leverage this using PolyBase. And along with this, you do not have to extract the data from Hadoop or another format, into a table to query it. You can query it directly and then insert the rows into a table. Which means development time is that much quicker.

Real-time Operational Analytics & In-Memory OLTP

Once again the guys at Microsoft have been able to leverage off their existing findings with regards to In Memory OLTP and the column store index. And they have mentioned in their testing that this amounts to 30x improvement with In-memory OLTP as well as up to 100x for In-Memory Column store. This is really amazing and makes everything run that much quicker.

On a side note, I did read this article today with regards to SAP: 85% of SAP licensees uncommitted to new cloud-based S/4HANA

I do find this very interesting if you read the article. What it mentions is that firstly 85% of current SAP customers will not likely deploy to the new S/4HAHA cloud platform. Which in itself does not tend well for SAP.

But what I found very interesting is that to make the change would require companies to almost start again for this implementation. In any business where time is money, this is a significant investment.

When I compare this to what Microsoft has done with the In-Memory tables and column store indexes, where they can be used interchangeably, as well as there is some additional work required. On the whole it is quick and easy to make the changes. Then you couple this with what Microsoft has been doing with Microsoft Azure and it makes it so easy to make the smart choice!

SSAS (SQL Server Analysis Services)

I am happy to say that at least SSAS is getting some attention to! There were not a lot of details but what I did read is that SSAS will be getting an upgrade in Performance usability and scalability.

I am also hoping that there will be some additional functionality in both SSAS OLAP and Tabular.

SSIS (SQL Server Integration Services)

Within SSIS, there are also some new features, namely they are also going to be integrating Power Query into SSIS. This is once again wonderful news, as it means now that SSIS can also get data from virtually any source!

Power BI

Once again the guys within the Power BI team have been really busy and below is what I have seen and read about in terms of what has been happening within Power BI

Office 365 Content Pack

I would say that there are a lot of businesses that are using Office 365 in some form or other. So it makes perfect sense for Microsoft to release a content pack for Office 365 Administration

As you can see from the screenshot below, it gives a quick overview on the dashboard to see what activity is happening. As well as details of other services. I am sure that this will make a quick overview of your Office 365 systems really easy to see. And also if there are any potential issues, this could also be highlighted!

Visual Studio Online Content Pack

Another content pack that is about to be released is for people who use Visual Studio Online, I personally do not currently use this. But it does look great for people to once again have a great overview of what is going on.

You can read more about it here: Gain understanding and insights into projects in Visual Studio Online with Power BI

And as you can see below, what you can view once you have got it setup within Power BI.

Power BI planned updates

Below are the updates that I had previously voted for in Power BI. It is great to see that the Microsoft team is actively listening to their customers and implementing some of the idea’s. I have to say that I do not think that there are many other software companies that are doing this currently. And also being able to roll it out as quickly as Microsoft is.

Set Colors and Conditional Formatting in visuals

  • This is great as it will allow the report authors to have more control in terms of how their reports look.

Undo / Redo button in browser & designer

  • This might seem like a small update, but I know personally from working with the Power BI reports, that sometimes you just want to see what a different report looks like. Or adding another element. And with the Undo / Redo buttons, it just saves that little bit of time, as well as to make the report authoring experience that much more enjoyable.

Power BI Announcements from Microsoft Ignite

Below are some announcements that I have read up about either on Twitter or one of the blogs that I follow. It is really great to see so many things in the pipeline.

This means that there is a lot to look forward to, as well as ensuring that we have new and wonderful things to show.

I got this picture via Twitter, which someone must have taken at the Microsoft Ignite Conference. As you can see it is not very clear, but it does show the next update in the Power BI Designer.

You can also see the undo and redo buttons.

It also appears that in the Power BI service, there will be support for SSRS files, namely the .rdl files! Here is another picture taken from Microsoft Ignite.


Then there is the Many to Many relationships and bi directional cross filtering will be supported in SQL Server 2016 tabular models, which I am sure will also be included in the new Power BI backend. As this is where it stored all the data.


For Hybrid BI, there will be support for live querying for SSAS, currently this is already in place for SSAS Tabular.


It also looks like there will be a scheduled refresh for SQL Server Databases as a source. Which is great for people who either do not have either of the SSAS cubes, or want to get some of their data into Power BI.

Microsoft Azure Stack

While this is not exactly BI, it is related to BI, in that with Azure Stack you can get the Azure functionality on your own hardware which is fantastic. And I am sure for a lot of businesses this will be welcomed.

You can read more about it here: Microsoft Brings the Next Generation of Hybrid Cloud – Azure to Your Datacenter


BI-NSIGHT – Azure Analytics Services – Power BI Dynamics AX Connector – Auto refreshing of Excel Files in Power BI – Excel 2016 Updates

Once again this past week Microsoft as released even more products. So let’s get started.

Azure Analytics Services

On 29 April at the annual Microsoft Build conference they announced new services on the Azure platform. I really think that Microsoft is doing a great job of having an entire cloud platform available for customers.

Due to the digital age and a lot of data is coming from mobile devices, which in turn are using digital services, I can see looking forward that as Microsoft says in their video, there will be a major requirement going forward for businesses to be able to use digital platforms in order to gain insights into their data.

With the Azure Analytics Services, this enables businesses to easily use products, without having to actually build the infrastructure and knowledge on the platform.

I am going to highlight the two new services which relate to BI. The Azure SQL Data Warehouse and the Azure Data Lake.

Azure SQL Data Warehouse

I really think that this is a smart move from Microsoft. It is something that we have been looking for and asking for from Microsoft. From the video (Build 2015: Azure SQL Data Warehouse) it appears to me that not only will it be a data warehouse, but also enable you to move data in and out of the data warehouse using SSIS.

I do hope that my assumption is correct, as this would be a great feature to have SSIS on a cloud platform. And this has the potential to create a whole host of new possibilities.

Along with this, it also appears from what I read that they are using the APS (Microsoft Analytics Platform System) as a basis for the Azure SQL Data Warehouse. If this is indeed true, I think that this could be a game changer. Due to the fact that we already know how easily it is to scale out with the APS. Which gives amazing performance.

Another great advantage is it looks like you can use the Azure SQL Data Warehouse as a source in Power BI. Which then enables all the features of Power BI. This combination I think would make a great competitor to other BI cloud products on the market.

Also as per the video, they have made it really easy to change the scale of computing that you require. It is really easy to complete and it can be changed in seconds!

Credit: Microsoft

Azure Data Lake

This is another clever move, allowing businesses to store all their data in a Data Lake. Which then gives the business the flexibility to then use this with the various Azure Services.

Here is a link to the video (Build 2015: Data Lake)

What I think will be great is that you can then take data from your data lake, either put this into Azure SQL Data Warehouse, or then use a Machine Learning API to run over your data. After you have got the required results, you could then put this into your Azure SQL Data Warehouse, and put Power BI on top of this to visualize your results and see based on your specific Machine Learning API, what affect it could potentially have!

You also have the potential to use existing Machine Learning API developed by other people, which means that you do not have to spend countless hours trying to get the correct Machine Learning algorithm!

Here is an overview of the Azure Analytics Services from Microsoft

Credit: Microsoft

Here is the blog post from Microsoft: Microsoft Announces Azure SQL Database elastic database, Azure SQL Data Warehouse, Azure Data Lake

Power BI Dynamics AX Connector

Just a quick note that I received an email that the Power BI guys have started planning for the integration of Dynamics AX as a connector in Power BI.

I am sure that this is welcoming news for Microsoft Dynamics AX customers

Power BI Dynamics AX – Planned

Automatic Refreshing of Excel Workbooks in Power BI

Just a quick review of my blog post this week, which was really well received.

It just explains how using a Power Query and Power Pivot, in which you use to get data into Excel Workbook, you can then have a mechanism how to get your Power BI report updated automatically.

This means that you can have your data on premise which you can then ensure gets into Power BI and then can have the potential for real-time updates.

AUTOMATING REFRESHING OF POWER BI REPORTS AND DASHBOARDS WITH EXCEL WORKBOOKS AND POWER UPDATE

Excel 2016 Updates

Just another quick note if you want to read up about the updates for Excel 2016, head over to Chris Webb’s blog post which has all the relevant information.

Chris Webb – What’s New In The Excel 2016 Preview For BI?

That is it for this week, another busy week and a lot going on!


Power Pivot and DAX in Power BI

Introduction: Something got me thinking the other day when I used the Google Analytics Connector and saw what looked like to me was a Power Pivot Model, as well as an image. I know in the current Power BI Designer as well as when you import an Excel file into Power BI on the web front end, you do not get to see these options. So it got me thinking, how is Microsoft doing this?

After some playing around I found a simple and easy solution!

NOTE: This does not currently work with Excel 2016

What this enables you to do, is to have your entire Power Pivot Model, along with your DAX calculations, as well as the synonyms within your Power Pivot Model available in Power BI!

Below is a screenshot of my completed dashboard, after which I will explain how I did it, and then an example with the Power Pivot Model, DAX calculation, Image as well as a synonyms!

I have used data from the AdventureWorksDW2014 database to get data into my Power Pivot Model.


How to get Power Pivot, with DAX calculations and Synonyms into Power BI

You guy are going to love how simple this really is to get completed.

  1. Create your Power Pivot Model, DAX Calculations and if required your synonyms.
    1. NOTE: You can load your data from Power Query into your Data Model (which is Power Pivot)
  2. Then what I did was to first create a really simple
    Pivot Table with a chart.
  3. Next I then created a Power View report, by going into the Insert
    Ribbon and then clicking on Power View, after which I created my Power View Report as shown below
  4. Then I saved my Excel Workbook.
  5. Next I uploaded the Excel Workbook to Power BI.
    1. NOTE: I uploaded it directly from my PC, as well as from One Drive for Business and they both achieved the same results.
    2. I had the following while it was being imported
  6. Now before I go on, I wanted to show you what my Power Pivot Model looked like in Excel.
    1. From the above screenshot, you will see that I have created two DAX
      Calculations.
      1. Sales Amount
        1. This is just a sum of the SalesAmount
      2. PM Sales
        1. This is a DAX
          Calculation that I found in http://www.daxpatterns.com/time-patterns/
        2. I then used this and applied it to my data.
      3. NOTE: The two DAX Calculations above is to show that they can then be used within Power BI
  7. Now once I had uploaded my Excel
    Workbook I went into the report in Power BI and saw the following:
    1. As you can see above this is identical to my Power View report in Excel.
  8. Then if I click on Edit Report, I see the following in Power BI, as you will notice below, I added an additional Combo Report, using the Sales and PM Sales amount.
    1. Which as you can see above, is my original Power View report, but added an additional chart, using the DAX Calculations from my Power
      Pivot Model.
    2. NOTE: You can see that it has my DAX Calculations of Sales Amount and PM Sales available and ready to be used.
  9. As you can see from above, you can now have a fully functional and working Power Pivot Model, with most of the Power Pivot features such as DAX Calculations and Synonyms available to be used with Power BI!
  10. So in a nutshell all that you need to do is to add a Power View report within your Excel workbook. Which will then enable the Power Pivot model to be available in Power BI

For the Synonyms to work, I simply added them within my Power Pivot Model, under the Advanced tab.

Adding an Image for Power BI from Excel

  1. To get the image embedded, I simply added it to my Power View Report in Excel.
  2. Then once I uploaded my Excel Workbook, I could then Pin the image to my dashboard.

In future blog posts, I will explain how I got Dashboards working when they are not created automatically in Power BI.

Link to Excel File

Below is a link if you want to use my Excel File and then upload it to your Power BI site

Please note, the only reason for the image for my blog, is I had to put in some type of image and I could not think of anything else to put in there!

Adventure Works DW – Power BI Power Pivot Example.xlsx

The future for me

I was reading through the email from The Databse Weekly and I saw an article from Paul Randal with regards to Paul being your mentor. This really got me thinking and where is my future within Business Intelligence (BI).

I really love what I do. I get great satisfaction and enjoyment when I can tell people a story about their data. Or show them insights into their data for the first time.

I find it easy to grasp new concepts and get it all working. I work entirely within the Microsoft BI toolset.

With the new Office 365 and Power BI offerings there is a whole new world to get my head around. It really excites me.

I have also started working for a BI consulting company and it equally exciting times here. They are looking to expand and really get into the Microsoft BI space. That’s where I come into the picture.

I feel that I am at the right place at the right time. In terms of using my existing knowledge within the Microsoft space, as well as enabling the consultancy to grow from strength to strength going forward.

This is where I feel that the being mentored by Paul Randal could get me onto the next level, which is where I want to go and where I will eventually get to. Being mentored by someone as knowledgeable and experienced means I can get there a little quicker!

So where do I see myself in the future?

I see myself learning and going to that next level. Enabling businesses to gain insights to their data faster and quicker than ever. As well as driving the BI consultancy to become the go to consultancy for Microsoft BI.

SSAS – KPI’s – How Explanation of KPI Makeup

Below is an overall description of what is needed for the KPI’s when creating them in BIDS


1.       After you click on New KPI you will have a window shown below and underneath the picture are the details required for each section:

2.        

                       clip_image002[4]

a.        Where it says Name:

                                                               i.      This will be the name for your KPI

                                                              ii.      NOTE: Make sure that it is descriptive and makes sense to the end user

b.       Associated Measure group:

                                                               i.      This is to which measure group you are associating the KPI.

c.        Value Expression:

                                                               i.      This is where you will use a measure to get the actual value of your KPI at Run time.

d.       Goal Expression:

                                                               i.      This is the goal or what you would like your KPI to get to

                                                              ii.      EG:

1.       You have people logging into your system and the more than can log in every minute the better.

2.       So it is decided that 500 logins per minute is the goal.

3.       Then in the Goal Expression you would put 500

e.       Status Expression:

                                                               i.      This is where you define that status is good, ok or bad for your gauge.

                                                              ii.      NOTE: You can change the status indicator to one that makes the most sense.

                                                            iii.      With the Status Expression it can also have three values

                                                            iv.      EG:

1.       1 is always good

2.       0 is always Ok

3.       -1 is always Bad

f.         Trend Expression

                                                               i.      This is where you define what the trend is for the KPI, meaning is it currently getting better or worse.

                                                              ii.      NOTE: You can change the Trend indicator to one that makes the most sense.

                                                            iii.      With the Trend Expression it can also have three values

                                                            iv.      EG:

1.       1 is always good

2.       0 is always Ok

3.       -1 is always Bad

Relocating to Australia – BI Job opportunities in Queensland

I thought I would let you guys know that I am about to relocate to Australia from South Africa. I have had an amazing time in South Africa, and learnt a whole lot whilst working at my past employer.

So this is a plug at anyone who has any lead or potential BI work in Queensland, Australia. I would really appreciate it, if you have anything to please email me.

I will be in Australia from 08 August 2014.

Below is a link to my CV and as well as my contact details.

CV-Gilbert Quevauvilliers-2014

Thanks

Gilbert

SSIS – Using SQL Server Analysis Services (SSAS) MDX query into Variable in Execute SQL Task

What I wanted to do was to get the output from my MDX query, and then use this in SSIS and take the output and put it into an SSIS Variable which could then be used later in your SSIS Package.


Example:

·         We are going to get the Internet Sales Amounts for 2 days.

o    01 June 2008 – $44,650.70

o    02 June 2008 – $35,496.03

·         Then we are going to put the two values into a variable.

·         Then we are going to use a Precedence constraint to compare the values, and if the Internet Sales amount is lower when compared then continue onto the next step.

o    So if the value on 02 June 2008 is lower than the value on 01 June 2008 continue to the next step.

o    So as from the above values it should continue onto the next step.

o    If the amount is higher then do not do anything.

·         NOTE: The reason that we are using an MDX query is so that we can get our data back as quickly as possible.


You can get a copy of this here: http://msftdbprodsamples.codeplex.com/releases/view/55330

·         I used the AdventureWorksDW2012 Data File and AdventureWorks Multidimensional Models SQL Server 2012


1.       The first thing that we are going to do below is get our MDX query which connects to the AdventureWorksDW2012 SSAS Cube.

a.        This query is for Internet Sales for 01 June 2008

Selectnonempty {[Measures].[Internet Sales Amount]} on 0

,nonempty {(

                     [Date].[Date].&[20080601]

                     )} on 1

from [Adventure Works]

                                                               i.       

b.       This query is for Internet Sales for 02 June 2008

Selectnonempty {[Measures].[Internet Sales Amount]} on 0

,nonempty {(

                     [Date].[Date].&[20080602]

                     )} on 1

from [Adventure Works]

                                                               i.       

2.       Now create your new SSIS Package.

3.       Next we will create our 2 variables that will be used to populate using the MDX queries above.

4.       Below is how we have created them:

a.        clip_image002[1]

b.       NOTE: We have created them as Int64 due to us getting back a numeric value.

                                                               i.      And this can also be compared in our Precedence Constraint

5.       Next we need to create an OLE DB Connection to our SSAS Cube by doing the following below:

a.        Right click in your Connection Managers section and select New OLE DB Connection

b.       When the window opens click on New

                                                               i.      Now from the drop down select the following:

1.       clip_image004[1]

2.       NOTE: You have to select the above so that we can connect to our SSAS Instance.

                                                              ii.      Now once configured you will see the following below:

1.       clip_image006[1]

                                                            iii.      If you want you can click on Test Connection to ensure that it can connect.

                                                            iv.      Then click Ok and then Ok again.

c.        You should now see the following in your Connection Managers Window:

                                                               i.      clip_image008[1]

                                                              ii.      NOTE: If required you can make this a Project Connection if your SSIS Project is in Project Deployment mode.

6.       Now what we are going to do is to assign our MDX Query to our variables using the Execute SQL Task.

7.       Drag in an Execute SQL Task and complete the following steps for One Day back

a.        As per our example I renamed the Execute SQL Task to the following:

Get Internet Sales Amount for One Day Back into Variable

b.       I went into the Execute SQL Task Properties and configured it with the following:

                                                               i.      clip_image010[1]

c.        We then selected our OLE DB connection that we created in step 5 above:

                                                               i.      clip_image012[1]

d.       Next under SQLStatement we are then using our MDX query from Step 1a above:

                                                               i.      clip_image014[1]

                                                              ii.      Then click Ok.

e.       Next click on the Result Set and click on Add

                                                               i.      Now where it says Result Name change this to the following:

[Measures].[Internet Sales Amount]

                                                              ii.      And then ensure that the Variable Name is:

User::InternetSales_OneDayBack

                                                            iii.      clip_image016[1]

f.         Then click Ok.

g.        Now right click and select Execute Task to test that the variable will be populated.

h.       clip_image018[1]

8.       Drag in an Execute SQL Task and complete the following steps for Two Days back

a.        As per our example I renamed the Execute SQL Task to the following:

Get Internet Sales Amount for Two Days Back into Variable

b.       I went into the Execute SQL Task Properties and configured it with the following:

                                                               i.      clip_image010[2]

c.        We then selected our OLE DB connection that we created in step 5 above:

                                                               i.      clip_image019[1]

d.       Next under SQLStatement we are then using our MDX query from Step 1b above:

                                                               i.      clip_image021[1]

                                                              ii.      Then click Ok.

e.       Next click on the Result Set and click on Add

                                                               i.      Now where it says Result Name change this to the following:

[Measures].[Internet Sales Amount]

                                                              ii.      And then ensure that the Variable Name is:

User::InternetSales_TwoDaysBack

                                                            iii.      clip_image023[1]

f.         Then click Ok.

g.        Now right click and select Execute Task to test that the variable will be populated.

h.       clip_image025[1]

9.       Now the final step is to have a next step to go to if the value is lower.

10.    For our example we are going to put the next step as a Send Mail Task

a.        So we dragged in the Send Mail Task and configured it so that it can send an email if run.

b.       Next we dragged the success precedence constraints as shown below:

c.        clip_image027[1]

d.       NOTE: The reason it was done in this order is so that we can get both variables populated before we change the constraint options.

e.       Now double click on the success precedence constraint that goes from Get Internet Sales Amount for Two Days Back into Variable to the Send Mail Task

                                                               i.      clip_image029[1]

f.         Now in the Precedence Constraint Editor Window complete the following:

                                                               i.      Change the Evaluation operation from Constraint to Expression

                                                              ii.      clip_image031[1]

g.        Then where it says Expression click on the Ellipses button.

h.       Now in order to check if the value is less to continue we put the following:

@[User::InternetSales_OneDayBack] <  @[User::InternetSales_TwoDaysBack]

                                                               i.      Click on Evaluate Expression to ensure that it is valid.

                                                              ii.      clip_image033[1]

i.         Then Click Ok and Ok again to go back to the Control Flow

11.    Now finally run your SSIS Package and it should complete with the following as shown below:

12.    clip_image035[1]

13.    NOTE: If you had to change your Precedence Constraint to the following below and re-run the above in order to test if the value was higher you would get the following result:

a.        clip_image037[1]


Book Review – Expert Cube Development with SSAS Multidimensional Models

http://www.packtpub.com/expert-cube-development-with-ssas-multidimensional-models/book

This book is a must read if you are looking for some useful and practical information in your SSAS Multidimensional models. But it must be noted that this is not an introduction into SSAS Multidimensional modelling, rather practical real world examples.

I found that the book is a wealth of information that can be applied to your working environment. There are a lot of real world examples that I have had a look at and made me check and update my SSAS Multidimensional models so that they can be that much faster and quicker.

It is also a great reference book, for when you are looking for a specific issue, where you can find the requirement and how to solve your particular issue.

I also really enjoyed the book, because it got straight into the requirement and then explained how to potentially solve or improve your requirement. Along with this I found that it was great where they applied their working experience in what they encountered and how they overcome an issue.

It is written by the guys who I consider to be some of the leaders in SSAS Multidimensional modelling. And you can see by the context of the detail in the book, as well as their examples that this happens often in the working environment, and how to get the best performance from your SSAS Multidimensional models.

A great read and I would recommend this book to anyone who is looking for a wealth of information as well as some great insight into the inner workings of SSAS Multidimensional models.

Excel – User Input for Custom MDX query using VBA and Pivots

I had a requirement where I wanted to do the following for a particular Power User

·         Give them the ability to put in a Date as a parameter in an Excel Workbook.

·         Once I have this date, is to the have a custom MDX query, which will then go and get the required data for the date.

o    NOTE: The reason for the custom MDX query was due to the volume of data returned I wanted to limit the data and query, thereby making the results return as quickly as possible.

·         This must then be queried and returned to Excel, where the results could then be pivoted.

·         After which the user could then create his Pivot and chart based on his date.

·         And essentially for the user to just input his date and click a button.


Working Example

·         I wanted the user to put in his Date (01 June 2008) which will then return all the Products and Product Lines for that date inputted.

·         The outcome will be in the same sheet once the user has clicked on the button Click to Refresh clip_image002[4] their Pivot and Chart will then be updated.


NOTE:

·         VBA is new to me, so I am aware that there is no error checking in place.

·         I also do not validated that the date is in the correct format for the user input. I am going to assume that I have explained to my user what date format to use.


You can get a copy of this here: http://msftdbprodsamples.codeplex.com/releases/view/55330

·         I used the AdventureWorksDW2012 Data File and AdventureWorks Multidimensional Models SQL Server 2012


Creating the VBA Function within Excel

The first part is to hard code the VBA function to ensure that we can get our data returned correctly to our Sheet in Excel.


NOTE: You might have to enable the Developer Ribbon, which you can reference here: http://office.microsoft.com/en-za/excel-help/show-the-developer-tab-HA101819080.aspx


1.       Click on the Developer Ribbon and then click on Macros

a.        clip_image004[4]

2.       This will then open the Macro Window

3.       Where it says Macro Name, put in a name for the Macro you are going to create.

a.        As with our Example I put the following Macro Name:

b.       clip_image006[4]

c.        Then click on the Create Button

4.       This then opens the Microsoft Visual Basic for Applications Window

5.       You will now see on the left hand side under Modules, it has Module 1

a.        clip_image008[4]

6.       On the right hand side is where we will be putting in our VBA code in our AW_ProductsByDate

a.        clip_image010[4]

7.       The next that you HAVE to do is to add the Microsoft ActiveX Data Objects 2.8 Library to your VBA function otherwise it will not recognize some of the coding later.

a.        To do this click on Tools and then Reference

                                                               i.      clip_image012[4]

b.       Once this opens the References – VBAProject, you are going to have to scroll down quite a bit until you find the following:

                                                               i.      clip_image014[4]

                                                              ii.      As shown above put a tick next to Microsoft ActiveX Data Objects 2.8 Library

                                                            iii.      Then click Ok.

c.        Now if you want you can save your workbook.

d.       NOTE: when saving your workbook you have to save it as an Excel Macro-Enabled Workbook as shown below. If this is not done then your Macro will not run.

                                                               i.      clip_image016[4]

8.       Now in the section below I will explain each section, while at the end I will have the entire VBA function so that you can copy and paste it.

9.       In the first section is where we are actually just declaring our Variables to use later.

‘Declare variables

Set objMyConn = New ADODB.Connection

Set objMyCmd = New ADODB.Command

Set objMyRecordset = New ADODB.Recordset

Dim Input1 As String

‘Input1 = ActiveWorkbook.Sheets(“Sheet1”).Range(“A2”)

a.        What we are doing above is setting our connections.

b.       Then where we have the DIM Input1 this is where we are creating our input variable

                                                               i.      NOTE: This has been commented out and will be explained in the later steps how to get it working.

                                                              ii.      Dim Input1 As String

                                                            iii.      Then we are setting the location of our Input1 variable

ActiveWorkbook.Sheets(“Sheet1”).Range(“A2”)

1.       NOTE: The above means on our Active Workbook, on the sheet namedSheet1look in the columnA2

                                                            iv.      We will only be using the input later once we have got everything configured.

10.    In the next section is where we open and create our connection to our SQL Server Analysis Services Database

‘Open Connection

objMyConn.ConnectionString = “Provider=MSOLAP.5;Integrated Security=SSPI;Persist Security Info=True;Initial Catalog= AdventureWorksDW2012;Data Source=ServerName\OLAP;MDX Compatibility=1;Safety Options=2;Protocol Format=XML;MDX Missing Member Mode=Error;Packet Size=32767″

objMyConn.Open

a.        NOTE: In the above connection string you will have to modify the following for your environment.

b.       For Initial Catalog highlighted in RED you will have to change this to the name of your SSAS Database.

                                                               i.      In our example it was:

1.       Initial Catalog= AdventureWorksDW2012

2.       NOTE: Ensure to get the Database ID, and not the name to ensure that you can connect to the database correctly.

c.        For the Data Source, this is your Server name, and in our example it is highlighted in BLUE

                                                               i.      Data Source=ServerName\OLAP

d.       The other settings are optional settings for if data is going across a slower network and to potentially speed up queries.

11.    In the next section is where we actually put our MDX query

‘Set and Excecute SQL Command

Set objMyCmd.ActiveConnection = objMyConn

objMyCmd.CommandText = “Select ‘ {[Measures].[Internet Sales Amount]} on 0 ” & _

                        “,’ {( ” & _

                                    “[Date].[Date].&[20080601], ” & _

                                    “[Product].[Product Line].Children, ” & _

                                    “[Product].[Product].Children ” & _

                                    “)} on 1” & _

                        “from [Adventure Works]”

objMyCmd.CommandType = adCmdText

objMyCmd.Execute

a.        As you can see above the section that you need to change is after the objMyCmd.CommandText

b.       A thing to note is that you have to start your query with the double quotes

                                                               i.     

c.        And if you are going to continue it on another line and not have it all on one like then at the end of each line you need to put the following:

                                                               i.      ” & _A

d.       With our query above you can see for now that we have hardcoded our query.

e.       NOTE: We will come back later and update it to get the details from the Input1 variable we created in step 9 above.

f.         The rest of the syntax just executes the MDX query.

12.    The next section just opens the recordset

‘Open Recordset

Set objMyRecordset.ActiveConnection = objMyConn

objMyRecordset.Open objMyCmd

13.    Now in this next section we are going to copy the data to Excel

‘Copy Data to Excel

ActiveWorkbook.Sheets(“Dataset”).Range(“A2”).CopyFromRecordset (objMyRecordset)

‘ActiveWorkbook.Sheets(“Dataset1”).Range(“DownTimeTable”).CopyFromRecordset (objMyRecordset)

a.        As you can see above what we are doing is to copy from the recordset to a sheet called “Dataset” and then insert it starting at “A2

b.       NOTE: You will see that there is a section commented out below. We will come back and change this in further steps.

c.        What we now need to do is to create our sheet that is referenced above calledDataSet

d.       If you click on your Excel Workbook, and the plus sign next to Sheet 1, it will create Sheet 2

                                                               i.      clip_image018[4]

e.       Right click on Sheet2 and select Rename

                                                               i.      Rename it to DataSet.

f.         Now we have created our Sheet which is referenced above.

14.    Now in the next section is where we will refresh our Power Pivot model which we will create in further steps.

‘This is to refresh the Power Pivot Model

ActiveWorkbook.RefreshAll

15.    The final part is to close the connection and end our code.

‘Close Connection

objMyConn.Close

End Sub

16.    Here is the entire code all in one block.

a.        NOTE: We will explain the Delete section in step 21 below

Sub AW_ProductsByDate()

‘Delete all data out of Table before inserting new data

With Sheet2.ListObjects(“ProductsByDate”)

        If Not .DataBodyRange Is Nothing Then

            .DataBodyRange.ClearContents

            .DataBodyRange.Delete

        End If

    End With


‘Declare variables

Set objMyConn = New ADODB.Connection

Set objMyCmd = New ADODB.Command

Set objMyRecordset = New ADODB.Recordset

‘Dim Input1 As String

‘Input1 = ActiveWorkbook.Sheets(“Sheet1”).Range(“A2”)


‘Open Connection

objMyConn.ConnectionString = “Provider=MSOLAP.5;Integrated Security=SSPI;Persist Security Info=True;Initial Catalog=AdventureWorksDW2012;Data Source=ServerName\OLAP;MDX Compatibility=1;Safety Options=2;Protocol Format=XML;MDX Missing Member Mode=Error;Packet Size=32767”

objMyConn.Open


‘Set and Excecute SQL Command

Set objMyCmd.ActiveConnection = objMyConn

objMyCmd.CommandText = “Select ‘ {[Measures].[Internet Sales Amount]} on 0 ” & _

                        “,’ {( ” & _

                                    “[Date].[Date].&[20080601], ” & _

                                    “[Product].[Product Line].Children, ” & _

                                    “[Product].[Product].Children ” & _

                                    “)} on 1” & _

                        “from [Adventure Works]”

objMyCmd.CommandType = adCmdText

objMyCmd.Execute


‘Open Recordset

Set objMyRecordset.ActiveConnection = objMyConn

objMyRecordset.Open objMyCmd


‘Copy Data to Excel

ActiveWorkbook.Sheets(“Dataset”).Range(“A2”).CopyFromRecordset (objMyRecordset)

‘ActiveWorkbook.Sheets(“Dataset”).Range(“ProductsByDate”).CopyFromRecordset (objMyRecordset)


‘This is to refresh the Power Pivot Model

ActiveWorkbook.RefreshAll


‘Close Connection

objMyConn.Close

End Sub

17.    Now if you click on the Run sub/UserForm as shown below your query should now run.

a.        clip_image020[6]

b.       Then on your Dataset Sheet you should see the output of your query.

c.        NOTE: If the query only returns one row, ensure that your query is not set to only show non empty results.

d.       clip_image022[4]

18.    In the next steps we are going to give our results column names and convert it to a table.

19.    So on the sheetDataset” at the top we put in the following column names:

a.        clip_image024[4]

b.       Then what we did is to select the entire range and clicked on Format as Table and formatted it as a table.

                                                               i.      clip_image026[4]

                                                              ii.      NOTE: Ensure to select My Table has headers

1.       clip_image028[4]

                                                            iii.      Click Ok

c.        You should now see this below:

d.       clip_image030[4]

e.       The final thing is on the top left hand side it will have Table Name, change this from Table1 to ProductsByDate

                                                               i.      clip_image032[4]

20.    Now the final step is to go back into your VBA Macro and change the following code:

‘Copy Data to Excel

‘ActiveWorkbook.Sheets(“Dataset”).Range(“A2”).CopyFromRecordset (objMyRecordset)

ActiveWorkbook.Sheets(“Dataset”).Range(“ProductsByDate”).CopyFromRecordset (objMyRecordset)

a.        You can see from above that we have now changed our dataset that is returned to go into our Table name from step 19 above.

                                                               i.      NOTE: This is so that when the number of rows changes we will always get back all the rows.

21.    What we are doing in the last part is to delete all the data in our table each time it runs.

a.        This is to ensure that there is no left over or incorrect data

b.       This will go at the top of your codeso that it will run first

‘Delete all data out of Table before inserting new data

With Sheet2.ListObjects(“ProductsByDate”)

        If Not .DataBodyRange Is Nothing Then

            .DataBodyRange.ClearContents

            .DataBodyRange.Delete

        End If

    End With


Taking the output from our VBA function creating our Pivots with a Chart.

In the next section we are going to take the output from our VBA function which was inserted into a table and then create our Pivot and Pivot Chart on our First sheet.


1.       Click on your table that you created in your sheet called “Dataset”

2.       Then click on the Insert ribbon, and then click on Pivot Table

a.        clip_image034[4]

3.       This will then open the Create Pivot Table Window, which you will configure with the following:

a.        Where it says Choose the data that you want to analyze leave the default which is shown below:

                                                               i.      clip_image036[4]

b.       Then where it says Choose where you want the PivotTable report to be placed, click on Existing Worksheet

                                                               i.      Then were it says location click on the box to select your location.

                                                              ii.      Now click on your Sheet 1, and click on Cell A6

                                                            iii.      So it will look like the following:

1.       clip_image038[4]

c.        Finally where it says choose whether you want to analyze multiple tables, click the tick box which is shown below:

                                                               i.      clip_image040[4]

                                                              ii.      NOTE: The reason that we add it to the Data Model is so that it actually puts in into Power Pivot.

1.       You can validate it, if you had to click on your Power Pivot ribbon and click on Manage you would see your data.

d.       So this is what the entire Window looks like:

                                                               i.      clip_image042[4]

e.       Then click Ok.

4.       Now we can create our Pivot and our Pivot chart.

5.       I created the following below:

a.        clip_image044[4]

b.       NOTE: While this does look quite simple it is used for our example.

c.        And the actual Pivot looks like this:

d.       clip_image046[4]


Creating the variable and button for the users input

Now in the final part what we are going to do is the following:

·         Define where we will get the users data from.

o    Convert this to the correct format which we need for our MDX query

·         Update our VBA code so that we can use this within our code dynamically.

·         Put in a button which will refresh everything based on the user input.


1.       Here we will first create our column and format it as required from the users Input

a.        So what we did is to put in some text so that the user knows what to do

b.       clip_image048[4]

c.        Next we put in a date in A2

                                                               i.      EG: 2008-06-04

                                                              ii.      NOTE: What we need to do though is to ensure that we format the A2 column as Text.

1.       The reason for this is we are going to substitute the date to the correct format which we require for our MDX query

                                                            iii.      clip_image050[4]

d.       Next in column B2 I put the following:

=SUBSTITUTE(A2;”-“;””)

                                                               i.      And you will then see that the column now has the following

                                                              ii.      clip_image052[4]

                                                            iii.      Now what I did is I moved the Chart from above to the side.

                                                            iv.      I then cut and pasted the above excel function and put it in cell D11

                                                              v.      clip_image054[4]

                                                            vi.      NOTE: The reason that I did this is so that the cell value would be hidden from the user. But we did NOT have to hide a cell.

e.       I then moved the chart and slicer back to where it belongs.

2.       Next we are going to go back into our VBA Code and update the Variable so that it will get the data from cell D11

a.        So you should still have your VBA window open.

b.       Under the Declare Variables section uncomment the two lines so that they look like the following below:

Dim Input1 As String

Input1 = ActiveWorkbook.Sheets(“Sheet2”).Range(“A2”)

c.        Now we are going to change the location of where the cell is from the above details to the following:

Input1 = ActiveWorkbook.Sheets(“Sheet1”).Range(“D11”)

d.       The next thing that we need to do is to change our MDX query from being hard coded to use the variable Input1

e.       So under the section ‘Set and Execute SQL command, go to the following line:

“[Date].[Date].&[20080604], ” & _

f.         Now we are going to change it to the following below:

“[Date].[Date].&[” & Input1 & “], ” & _

                                                               i.      What we have done above is in order to use the variable we have to encapsulate it with the following:

“& VariableName &”

c.        Now what you can do to test this is to click on the Run sub/UserForm as shown below your query should now run.

                                                              ii.      clip_image020[7]

g.        Now it should run through correctly and you should see your data updated in Sheet1.

3.       Now the final step is to add the button, which the user can press after they have put in their date.

a.        Go back into your Excel spreadsheet and onto Sheet1

b.       Click on the Developer Tab

c.        Then under the Controls section, click on Insert and then select Button

                                                               i.      clip_image056[4]

d.       Next you will need to drag your button where you want it to be.

                                                               i.      You could do this anywhere initially.

e.       After you have dragged in your button it will then open up the Assign Macro Window.

                                                               i.      From this Window select your VBA that you created.

                                                              ii.      clip_image058[4]

f.         Then click Ok.

g.        You will now see the following:

h.       clip_image060[4]

i.         Now in order to change the text on the button do the following:

                                                               i.      Right click on the Button 1 and select Edit Text

                                                              ii.      clip_image062[4]

j.         I changed it to the following:

Click to refresh data

                                                               i.      NOTE: I had to drag the button to make the text fit.

1.       Also whilst you are editing the text you could also change the font and size.

k.        I then moved it so it looked like the following:

l.         clip_image064[4]

4.       Now to finally test that it works I changed the date to:

a.        2008-06-05 and then clicked the button “Click to refresh data”

b.       Now after the data refreshed I saw my pivot change to the following:

c.        clip_image066[4]


Now you can save your Excel worksheet and send it to the required people

NOTE: Ensure that the users have the required access to the cube where the MDX will be running.


You can get a copy of the workbook here: http://1drv.ms/1dfKry4