BI-NSIGHT – Power BI (Natural Narratives Visual, Time Intelligence, Mobile App update iOS) – Excel 2016 (Power Query) – SQL Server 2016 (Mobile Report Publisher Update)

Here are this week’s updates some great things happened this past week.

Power BI – Natural Narratives Visual

This is a very interesting visual provided via Power BI. What this will do is to provide a narrative into your data via natural language. It does appear that your visuals will change based on what you use via the natural language.

It is very interesting and something that I want to see in action. I am sure that this will be a great addition in the Power BI toolkit.

You can find more details here: Get natural language narratives in Power BI Reports

Power BI – Time Intelligence

This has been something that I have seen a lot of people blog about, and it is great to have it finally here.

And no doubt it will mean that going forward there is now the ability to create even more meaningful and great Power BI reports and visualizations.

Power BI – Mobile App Update for iOS

It appears that there is another update for the Power BI Mobile App for iOS. And it is great to see these improvements, which will no doubt filter down to Android and Windows.

Excel 2016 – Power Query

Here are the updates for Excel 2016 with regards to Power Query.

It is great to see that this is finally getting some attention again, as it did appear that all the good work was going into Power BI. And it is great to see these changes coming into the Excel product also.

You can find all the details of the updates here: More April 2016 updates for Get & Transform in Excel 2016 and the Power Query add-in

SQL Server 2016 – Mobile Report Publisher Update

It is great to see another update for the Mobile Report publisher, as well as the additional features that they have added.

Once again Microsoft is paying close attention to what the users are looking for and then putting that into the product, which is great to see.

I do like that updates with regards to the custom report color palettes, as well as the saving of the simulated thumbnail data.

You can find out more details here: New Mobile Report Publisher preview now available

BI-NSIGHT – Power BI (April Service Update, Drill to Details, Mobile App Update, Governance & Deployment Approaches, Compliance, Webinar Series) – SQL Server 2016 (RC3, SSDT April Preview (RC3), Mobile Report Publisher Update, Cloud Backup & Restore) – BIML (BIML Express) – Azure (Free Resources to learn Cloud)

It has been a very busy week in the world of BI so here are the weekly updates.

Power BI – April Service Update

Late last week there was the monthly service update for Power BI, so below are some of the features that I would like to highlight.

It is great to see that you now can integrate with ExpressRoute, as we know Power BI does reside in Azure, so it makes perfect sense that now businesses can utilize this capability.

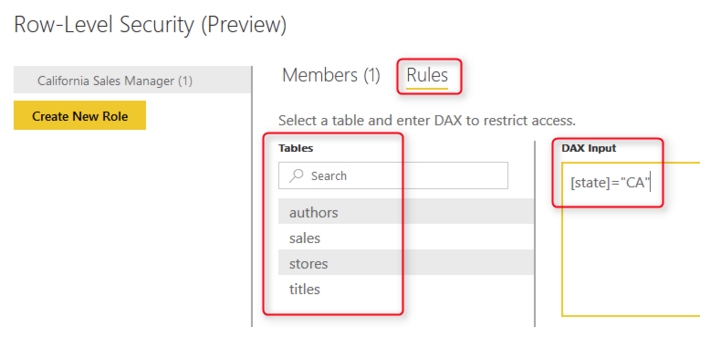
Also adding the Row Level Security (Preview) for Content packs, helps deliver a more robust and enterprise solution going forward.

And finally the last thing I would like to highlight is that the Analyze in Excel is available to all users. I do think that this is a smart and good move, in that everyone loves Excel and this will also enable even more people to use Power BI and leverage the work done.

You can read about it here: Power BI Service April Update: ExpressRoute for Power BI

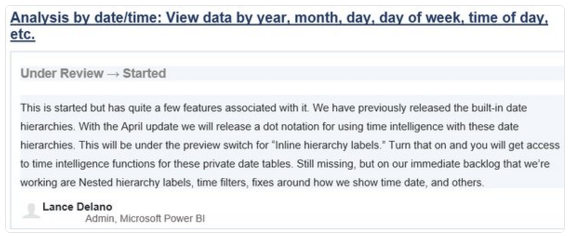
Power BI – Drill To Details

It is great to see this status update that they have started working on the Drill to Details, which I know a lot of people have been asking for, as can be seen by the votes.

In my mind this is similar to what we currently have when using Excel. It will be great to see what the final outcome looks like.

Power BI – Mobile App Update

It is great to see that the Mobile App for Power BI is also getting constant updates. This latest update has to do with SSRS on Android. And I have to say that it was doing things a lot faster than previously.

I did update and play around with the samples especially as per the above screenshots and it works really well.

I also like the way it is now presented, which makes it easier to use, even with the smaller screen.

And it is good to see that the global search and recent items are in iOS, they often get the features first before it goes to the Windows and Android App’s so something to look forward to.

There was another update yesterday (20 April 2016) in which there was a small update to SSRS and bug fixes and improvements.

You can find more details here: Power BI Mobile Apps Update – April 2016

Power BI – Governance & Deployment Approaches

This is another great white paper from the Power BI team, especially if you are in a larger organization and you are looking to see how best to roll this out to the users, using the typical DEV, QA, PROD lifecycle.

As well as the different ways that you can utilize Power BI based on how you want to leverage Power BI.

There were some interesting things that I noted when reading the white paper which I will highlight in another blog.

You can find the details about the white paper and download links here: Power BI Governance and Deployment Approaches

Power BI – Compliance (Trust Center)

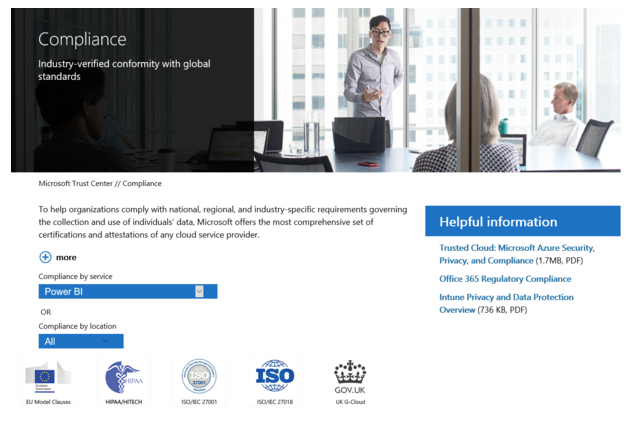
It is great to see that Power BI is now part of the Microsoft Trust Center. I think that this will go a long way especially for customers who were potentially worried about how safe their data is. As well as if it is secure.

You can read about it all here: Power BI Added to Microsoft Trust Center

Power BI – Webinar Series

It is great to see that you can how subscribe and get access to the webinar series. So this means that you can then view it at a time when it suits you from the community. Which I have no doubt that I will learn something along the way.

You can find out the details here: New Power BI community webinar series

SQL Server 2016 – RC3

This is the final release from the SQL Server team before the RTM. And it is pretty much feature complete. So in my mind this is pretty much going to be the final product, with some additional bug fixes and internal improvements.

It is going to be really good to play around with the new BI features and see how we can leverage this with SQL Server 2016.

You can read about the updates for RC3 here: SQL Server 2016 Release Candidate 3 now available

SQL Server 2016 – SSDT April Preview (RC3)

They have also updated the SQL Server Management Studio to RC3, and whilst every so often it seems to do something that does not want to load. When I try again it works and it does appear to be working really well.

You can find the details and download links here: SQL Server Data Tools Preview update for April 2016

SQL Server 2016 – Mobile Report Publisher Update

There was also an update for the SQL Server Mobile Report Publisher, which is also a good thing. As I did use it for a hour or two and it seems to be working well and really quick and easy to create mobile reports.

This is going to be great going forward for the On-Premise story.

You can download it from the following link: Microsoft SQL Server Mobile Report Publisher (Public Preview 4)

SQL Server 2016 – Cloud Backup & Restore

This is yet another great feature in SQL Server 2016, to back up your data to the cloud. As I have no doubt that most companies will either be using the cloud or looking into it.

This is just another great reason as to why it is so valuable. You can easily setup the job to back up to the cloud, and not have to worry about the storage devices, as well as having geo-redundant backups (which is perfect for disaster recovery scenarios)

As well as they have provided the ability to very quickly restore the databases from backups in the cloud. This is done by using the File-Snapshot backup, which means that you would not need to roll forward all the transaction logs from your last backup.

You can find more details here: SQL Server 2016 cloud backup and restore enhancements

BIML – BIML Express

I have to say that if you use SSIS a lot, or are getting into SSIS it will be a great addition in your tool belt if you can use BIML.

And now the great guys from Varigence have got BIML Express, which makes it a lot easier to write your BIML instead of using BIDS Helper. Do not get me wrong BIDS Helper is great, but the syntax highlighting and potential error highlighting will really help.

And it does appear to be free to use, after registration.

You can find out more details here: BimlExpress Visual Studio Add-in

Azure – Free Resources to help IT Pro’s get started

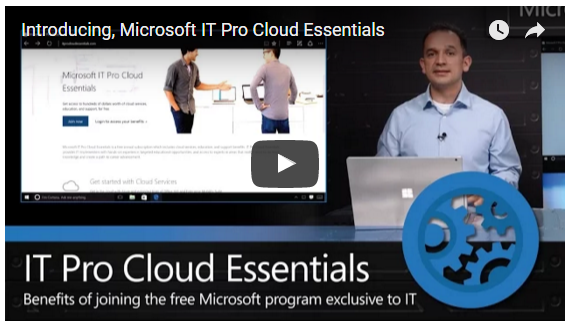
This is really a great offering from Microsoft and it is something that I am personally going to sign up to and complete. We are already looking at what we can leverage in the cloud and I think this will be a great start to learn it from the actual designers themselves.

As in the past I also feel that learning directly from Microsoft is a great way to start, as it will be along their best practice as well as ensuring that you do it right from the start.

You can find out the details here: Microsoft introduces free resources to help IT pros get started and build their careers in the cloud

Power BI – Ideal Visual Placement for multiple report elements

What we are going to explain below, is some basics when using Power BI so that you can place your visuals so that they all fit onto the screen.

Example: For our Example we are going to be using SCOM Data for SSAS Usage

  • Our requirement was to have ideally 9 charts on one Power BI page.
  • What we will explain below is what sizing we used and how we got it all to line up so that it was even.

NOTE: This does look to be a long blog post, but there are loads of pictures to explain, so it goes quite quickly.

  1. What you can see below is the final output, and we will explain how we got it all working:
  2. The first thing that we did was to get the right sizing for each of the report elements.
    1. We configured each of them by doing the following:
      1. Click on the report
        element.
      2. Then click on the Format
        Button
      3. Next scroll down to the bottom where it says General
      4. Now we configured our Report Elements with the following:
        1. NOTE: With the settings above, it will mean that we can fit in all 9 report elements.
      5. NOTE: If you have got a report element that is often on the right hand side of the report canvas and you try and enter a width where it cannot
        fit, you will see the following:
        1. What the above means is that it cannot expand to the desired
          width because there is no more space.
        2. As you can see above the report element is as far right as it can go.
        3. And there is a Red Box around the Width to show that it cannot expand.
        4. To get around this move the report element left, and then make the width change.
        5. This will also
          happen if you do this for the left, top and bottom.
  3. You can then go through and configure each of the 9 report elements as shown in step 3 above.
  4. In the next section below we will show you how to align all 9 reports for the Left, Center and Right
    alignment.
    1. NOTE: The easiest way that I found to do this was to do it in the steps below:
    2. First
      click on the report
      element that you want on the left
      hand side.
      1. Then in the ribbon click on Align and then select Align Left
        1. Then in order to get it done quicker, you can now select all 3 report elements that you want to be left aligned
        2. Now click on the ribbon again and click on Align and then select Align Left
          1. This will then align all 3 report elements to the left hand side.
          2. NOTE: It appears that it takes the report element that is the furtherest left aligned and aligns the rest of the report elements to this.
        3. Here are all 3 left aligned
          1. NOTE: You will see that they are aligned to the left, but not correctly spaced from top to bottom, we will do this in the following steps.
    3. Next
      click on each of the 3 report elements that you want to be in the Center.
      1. Then in the ribbon click on Align and then select Align Center
        1. Then in order to get it done quicker, you can now select all 3 report elements that you want to be Center aligned
        2. Now click on the ribbon again and click on Align and then select Align Center
          1. This will then align all 3 report elements to the center hand side.
          2. NOTE: It appears that it takes the report element that is the center aligned and aligns the rest of the report elements to this.
        3. Here are all 3 aligned to the center
          1. NOTE: You will see that they are aligned to the left, but not correctly spaced from top to bottom, we will do this in the following steps.
    4. Next click on each of the 3 report elements that you want to be in the Right
      1. Then in the ribbon click on Align and then select Align Right
        1. Then in order to get it done quicker, you can now select all 3 report elements that you want to be Right aligned
        2. Now click on the ribbon again and click on Align and then select Align Right
          1. This will then align all 3 report elements to the right hand side.
          2. NOTE: It appears that it takes the report element that is the furtherest right aligned and aligns the rest of the report elements to this.
        3. Here are all 3 aligned to the Right
          1. NOTE: You will see that they are aligned to the left, but not correctly spaced from top to bottom, we will do this in the following steps.
  5. In the next section below we will show you how to align all 9 reports for the Top, Middle and Bottom
    alignment.
    1. NOTE: The easiest way that I found to do this was to do it in the steps below:
    2. First click on the report element that you want on the top
      1. Then in the ribbon click on Align and then select Align Top
        1. Then in order to get it done quicker, you can now select all 3 report elements that you want to be top aligned
        2. Now click on the ribbon again and click on Align and then select Align Top
          1. This will then align all 3 report elements to the top of the report canvas.
          2. NOTE: It appears that it takes the report element that is highest and aligns the rest of the report elements to this.
        3. Here are all 3 top aligned
    3. Next click on the report element that you want on the middle
      1. Then in the ribbon click on Align and then select Align Middle
        1. Then in order to get it done quicker, you can now select all 3 report elements that you want to be Middle aligned
        2. Now click on the ribbon again and click on Align and then select Align Middle
          1. This will then align all 3 report elements to the middle of the report canvas.
          2. NOTE: It appears that it takes the report element that is highest and aligns the rest of the report elements to this.
        3. Here are all 3 middle aligned
    4. Next click on the report element that you want on the Bottom
      1. Then in the ribbon click on Align and then select Align Bottom
        1. Then in order to get it done quicker, you can now select all 3 report elements that you want to be Bottom aligned
        2. Now click on the ribbon again and click on Align and then select Align Bottom
          1. This will then align all 3 report elements to the bottom of the report canvas.
          2. NOTE: It appears that it takes the report element that is highest and aligns the rest of the report elements to this.
        3. Here are all 3 middle aligned
  6. NOTE: You might have to play around with the elements to get them to where you want them to be.
  7. So now once this is all done you can see them all aligned as shown as with the original picture:

BI-NSIGHT – Power BI (Passing Report Filters to Power BI in URL, Row Level Security Explained, Madeira Content Pack)

There is not a whole host that has happened in the past week, but always some interesting things to read about.

Power BI – Passing Report Filters to Power BI in URL

I must have somehow missed this somewhere along the lines, but I had no doubt that this would be done in the Power BI Service. As I do remember that you can do this with SharePoint and Power View.

It is great to see that you can pass report filters in the URL. I have used it successfully in the past when going from an SSRS style report, and passing the parameters to a Power View or now Power BI report. It complements the reporting experience very well.

You can find out more information here: Passing report filters to Power BI using URLs

Custom Format String SSAS 2016

This morning I saw this wonderful picture and it is great to see that you can now have your custom format string for SSAS Tabular. As I know that sometimes you will want to have the format for your own requirements.

Power BI – Row Level Security

This is a great post by Reza Rad with regards to how to use and implement Row Level Security in the beta phase in the Power BI Service.

I am fairly certain that there will be more updates over time, which will enable us to leverage the Row Level features that we currently use in SSAS Tabular.

You can read about it here: Row Level Security in Power BI; Regardless of Data Source

Power BI – Madeira Content Pack

Another week another great content pack if you are an existing Madeira customer. I have no doubt that for the people in the Business Management area will be able to view and understand their data a lot better with these reports in Power BI.

You can find all the details here: Explore your Project “Madeira” data with Power BI

BI-NSIGHT – Power BI (Service Update 2) – SQL Server (Dev Essentials) – SQL Server 2016 (RC2)

As of the time of writing this, there was not a lot going on this week. And it is quite understandable with all that happened in the Power BI area at the Microsoft Data Insights Summit. So here are this week’s updates.

Power BI – Service Update 2

I have to say that the Service Update 2, has a whole host of new features some of which were announced at the Microsoft Data Insights Summit.

Starting with the Dashboards it is great to see that you can now have a featured dashboard, which can showcase or you can put in there what is most important to you.

Along with this is the ability to Filter your dashboards, as already in my implementation we can see that there are a lot of dashboards created and shared by other people. So this makes the navigation that much easier.

With the Enterprise features I have to say it is great to have Usage reporting, of the reporting system (Ironic that!) but it does mean that we can see who is using and doing what. As I often find that you create dashboards or reports which the users are requesting with great importance, and then after you complete your work they hardly ever use it.

Next is the Row Level Security, and as previously explained and discussed, this is now like having SSAS Tabular in the cloud. And I have no doubt that it will get better with every release. And I am sure that at some point we will be able to put in some form of Dynamic Security, which will be great. But this does mean that we are on the way to have a SSAS Tabular SaaS.

And finally the ability to stop people from exporting the data is also something that can be of a concern to the Enterprise.

The other features I have already blogged about before, but finally it is good to see that us people in Australia can now sign up for the Power BI Service.

You can read all the info here: Power BI Service March Update Part 2

SQL Server – Dev Essentials free

I know that this has been on twitter for quite some time, but is great to see that you can now use SQL Server Developer Edition for free. I think it is a smart move by Microsoft, because it allows you to use all the features, and no doubt once you have developed a solution there is the potential that you have used an Enterprise feature, which would then require an Enterprise License. But even with that said it is still great to be able to use it for development purposes.

You can find out the details here: Microsoft SQL Server Developer Edition is now free

SQL Server 2016 – RC2

RC2 is out and one of the big improvements is that they have simplified the process for the R Services setup. Which is great as from what I read previously it was a tedious process to get this up and running.

It appears to me that the SQL Server team is working at a cadence that we have not seen before. I have no doubt that what the Power BI team is doing is starting to rub off on different areas within Microsoft.

I am sure that a lot of the details within RC2 is around the underlying code and bug fixes. But with that being said it is great to see another RC out, and I am sure there will be a few more before it goes to RTM.

You can find out the details here: SQL Server 2016 Release Candidate 2 now available