Automating running PowerShell script which required Administrator elevation via SSIS

What we are going to explain below is the following via an example.

Example – We are required to run a PowerShell script which will run with elevated privileges.

So in order to complete this we have to complete the following below but use a simple PowerShell script which will get all the FileNames from a Folder.

  • Create a BAT file which can execute the PowerShell script.
  • Create a Scheduled Task which in turn will call the BAT file.
  • Create an SSIS Package which will call the Scheduled Task

NOTE: The reason that we did this above, was to ensure that we could automate the snapshotting of the database using SSIS. This would enable us to get a snapshot of the data on a required schedule.

Changing the UAC

Below is a quick step to disable the UAC, as I think that this might affect the later steps when the BAT file is trying to run the PowerShell script.

NOTE: You will need to be an Administrator on the Server to turn this off.

  1. Go into the Control Panel.
  2. Then search for UAC.
  3. Then click on the Change User Account Control settings as shown below:
  4. Change it to Never Notify as shown below:
  5. Then click
    Ok
  6. It will ask you one last time if you want to make the change to the Computer.
    1. Click on Yes

Creating the BAT File which can execute the PowerShell script

In the steps below we are going to explain how we create the BAT file which executes the PowerShell script. And also show that at first we can run the PowerShell script manually to ensure that it works.

Testing the PowerShell Script

  1. The first thing to test is to ensure that the PowerShell script actually runs and completes as it should.
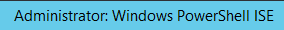
  2. Click on Start and then type in PowerShell and from the search results right click on Windows PowerShell ISE and select Run as Administrator
  3. Now when the PowerShell ISE opens you can see from the Window at the top that you are running as Administrator
  4. If you want to follow our example you can then copy and paste the following PowerShell script

    Get-ChildItem
    -Path
    ‘C:\Program Files\Microsoft SQL Server\MSSQL11.PRODBI\MSSQL’
    -Recurse
    |
    Export-Csv
    -Path
    ‘C:\Program Files\Program Files.csv’
    -Encoding
    ascii
    -NoTypeInformation

    1. What we are doing above is to get the File Names for all the files and folders under Program Files and then our SQL Server MSSQL Folder.
    2. And then export it to a CSV.
    3. As with our example once run you should see the CSV file as shown below:
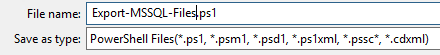
  5. Now we know that our script runs we can now save it to a location on our Server.
  6. As with our example we saved it to a new folder on the C:Drive
  7. We will now use this in the next steps to create the BAT File.

Creating the BAT file which will run the PowerShell script.

In the steps below we will be creating the BAT file which will run the PowerShell script.

  1. Open up Notepad or Notepad++ and copy in the following, which will be explained below:
    1. c:\windows\system32\WindowsPowerShell\v1.0\powershell.exe
      -ExecutionPolicy ByPass -command
      “. ‘C:\XIOSnapshot\Export-MSSQL-Files.ps1′”
    2. What we are doing above is to first put in the full location of PowerShell highlighted in GREEN
    3. Next we are putting in some parameters for PowerShell, which is to bypass the execution policy and the command that is to be run highlighted in PURPLE
    4. And then the final part is where we are calling the PowerShell script which we created above. It is highlighted in RED
      1. NOTE: In order to run the command, we have to put it all in double quotes, as well as it has to have a period in order for it to be executed.
    5. Now we can save this BAT File in the same location with a name.
    6. As per our example we saved it with the following:
  2. Now what we will need to do is to run the BAT file from the command line to test that it all works.
  3. You can now open command prompt and run the bat file as we have shown with our example below:
    1. NOTE: You can see that we are not logged into the Command prompt as Administrator.
    2. We can also see that it completed successfully.
    3. And finally if we look on the file system we can see the file got created.
  4. One final thing to note, is that this will run when we execute the BAT file as we have administrator privileges.

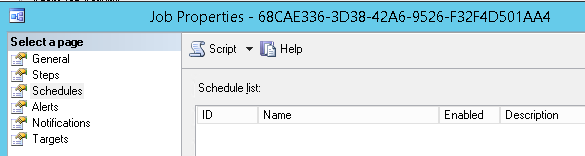
Creating the Scheduled Task which will call the BAT File

Now we are going to create the Scheduled Task which will call the BAT File.

  1. Go into Server Manager, then click on Tools and select Task Scheduler
  2. Once this opens on the right hand side click on Create Task…
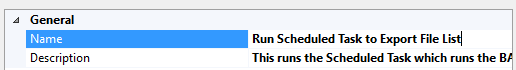
  3. The first thing that you have to give your task is a name
    1. As with our example we are going to give it the name as shown below:
    2. Now a VERY important step
      is under Security options make sure to select the Tick box as shown below:
      1. NOTE: With this it means that it will run with the highest privileges and will run as Administrator context
    3. Next if you are going to run this via SQL Server Agent, you are going to have to put in the same domain account
      context that SQL Server Agent Runs Under.
      1. NOTE: When you click ok for the creation of the Scheduled Task it will prompt for the password.
  4. You can leave Triggers blank, because we are going to execute this via SSIS.
  5. Click on Actions
    1. Then click New
    2. Then configure the New Action as shown below, with an explanation afterwards.
      1. Here we are just running our BAT File.
    3. Click Ok.
  6. You can now click Ok for this Scheduled Task to be created.
  7. NOTE: When you click ok for the creation of the Scheduled Task it will prompt for the password.
  8. The final step is to then test the scheduled task by running it within Task Scheduler.
    1. Click on Run
    2. You will briefly get the command prompt Window popping up, which you will not see when running via SSIS.
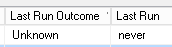
    3. To confirm this you can view the Last Run Result in Task Scheduler as shown below:
    4. As well as the file on the file system:
  9. Now we are done with the Task Scheduler, calling the BAT file, which is then calling the PowerShell script.

Automating the running of the Scheduled Task in SSIS

In the steps below we are going to show how to automate the running of the Scheduled Task within SSIS

  1. Either create a new SSIS Project or create a new SSIS Package.
  2. Then drag in the Execute Process Task into the Control Flow.
  3. Double click to go into the Properties.
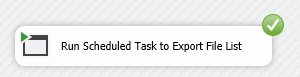
    1. We gave it the following name:
    2. Then click on Process to put in the details to call the Scheduled Task
    3. Now what you will see below is the details to run the Scheduled Task which will be explained afterwards:
      1. From the above under
        Executable, this is where the Scheduled Task exe is saved on our Windows
        Server 2012.
      2. Then under Arguments is where we specified for the Scheduled Task to firstly run (/run) and then the Task Name (/TN) to run
      3. Then click
        Ok.
    4. You should then see the following in your SSIS Package:
  4. Now to test that it all works, execute your SSIS
    Package.
    1. It should then run successfully and you should see the following:
    2. NOTE: That the SSIS will come back immediately saying that was successful if the command is correct.
    3. So if you have something else that is reliant on this step I would suggest putting in something to delay it going onto the next step.
      1. I did this by using the WAITFOR DELAY in SQL Server.
    4. Now we can see the file being updated as shown below:
  5. The final step is to then deploy this to your SSIS
    Server and create the scheduled task and test it.
  6. NOTE: If you have configured the Scheduled
    Task with the same
    domain
    account as your SQL Server Agent
    account it will succeed.
    1. NOTE: This domain account should not have a password that will change.
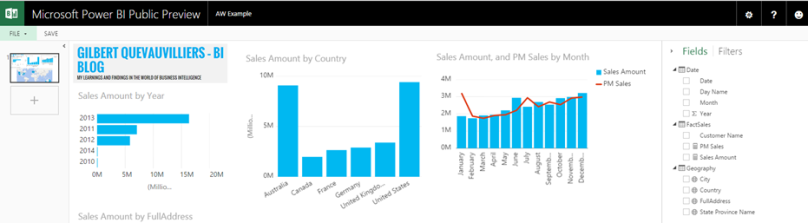
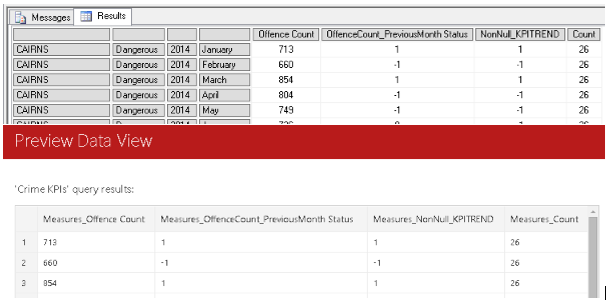
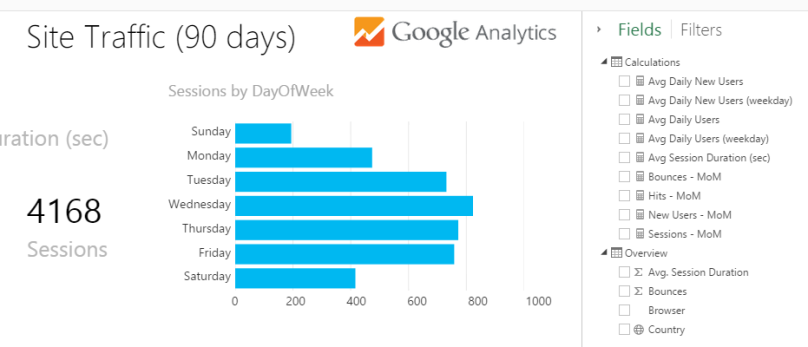
Power Pivot and DAX in Power BI

Introduction: Something got me thinking the other day when I used the Google Analytics Connector and saw what looked like to me was a Power Pivot Model, as well as an image. I know in the current Power BI Designer as well as when you import an Excel file into Power BI on the web front end, you do not get to see these options. So it got me thinking, how is Microsoft doing this?

After some playing around I found a simple and easy solution!

NOTE: This does not currently work with Excel 2016

What this enables you to do, is to have your entire Power Pivot Model, along with your DAX calculations, as well as the synonyms within your Power Pivot Model available in Power BI!

Below is a screenshot of my completed dashboard, after which I will explain how I did it, and then an example with the Power Pivot Model, DAX calculation, Image as well as a synonyms!

I have used data from the AdventureWorksDW2014 database to get data into my Power Pivot Model.


How to get Power Pivot, with DAX calculations and Synonyms into Power BI

You guy are going to love how simple this really is to get completed.

  1. Create your Power Pivot Model, DAX Calculations and if required your synonyms.
    1. NOTE: You can load your data from Power Query into your Data Model (which is Power Pivot)
  2. Then what I did was to first create a really simple
    Pivot Table with a chart.
  3. Next I then created a Power View report, by going into the Insert
    Ribbon and then clicking on Power View, after which I created my Power View Report as shown below
  4. Then I saved my Excel Workbook.
  5. Next I uploaded the Excel Workbook to Power BI.
    1. NOTE: I uploaded it directly from my PC, as well as from One Drive for Business and they both achieved the same results.
    2. I had the following while it was being imported
  6. Now before I go on, I wanted to show you what my Power Pivot Model looked like in Excel.
    1. From the above screenshot, you will see that I have created two DAX
      Calculations.
      1. Sales Amount
        1. This is just a sum of the SalesAmount
      2. PM Sales
        1. This is a DAX
          Calculation that I found in http://www.daxpatterns.com/time-patterns/
        2. I then used this and applied it to my data.
      3. NOTE: The two DAX Calculations above is to show that they can then be used within Power BI
  7. Now once I had uploaded my Excel
    Workbook I went into the report in Power BI and saw the following:
    1. As you can see above this is identical to my Power View report in Excel.
  8. Then if I click on Edit Report, I see the following in Power BI, as you will notice below, I added an additional Combo Report, using the Sales and PM Sales amount.
    1. Which as you can see above, is my original Power View report, but added an additional chart, using the DAX Calculations from my Power
      Pivot Model.
    2. NOTE: You can see that it has my DAX Calculations of Sales Amount and PM Sales available and ready to be used.
  9. As you can see from above, you can now have a fully functional and working Power Pivot Model, with most of the Power Pivot features such as DAX Calculations and Synonyms available to be used with Power BI!
  10. So in a nutshell all that you need to do is to add a Power View report within your Excel workbook. Which will then enable the Power Pivot model to be available in Power BI

For the Synonyms to work, I simply added them within my Power Pivot Model, under the Advanced tab.

Adding an Image for Power BI from Excel

  1. To get the image embedded, I simply added it to my Power View Report in Excel.
  2. Then once I uploaded my Excel Workbook, I could then Pin the image to my dashboard.

In future blog posts, I will explain how I got Dashboards working when they are not created automatically in Power BI.

Link to Excel File

Below is a link if you want to use my Excel File and then upload it to your Power BI site

Please note, the only reason for the image for my blog, is I had to put in some type of image and I could not think of anything else to put in there!

Adventure Works DW – Power BI Power Pivot Example.xlsx

BI-NSIGHT | Mobile BI from Microsoft – SQL 2014 SP1 – Power BI (Google Analytics Connector)

This is a slightly different post from what I have been posting in the past, which has been completely technically focused!

I have decided that I read up and look into so many things relating to the Microsoft BI eco system, that I should also share this with the readers and followers of my blog. Where I can give my thoughts and ideas on how best to use and leverage the multitude of offerings that are out there now in the BI space.

I have to admit that the updates, changes as well as new products is happening at a furious rate! And I am just trying to keep up with all of this! But I do enjoy it a lot and love having to research something or read about something new almost on a daily basis.

Right so let’s get into the good stuff!

Mobile BI from Microsoft

As we are all well aware Microsoft has been lacking in the Mobile BI space, and even though they have created an IOS app for Power BI, it is still in my mind a first release so there is a lot of catch up work to be done.

Now with Microsoft’s announcement of acquiring Datazen, they have made a very smart move in my book. (Yes I know that there are some people who have already voiced their opinion, in the hope to ensure that Microsoft does not complete another ProClarity debacle!) By acquiring Datazen, they have a great starting point for a Mobile BI offering. Which I have no doubt that they will work with the existing Datazen developers, and integrate this into the Microsoft BI eco system.

You can read about the details from the Microsoft blog here: Microsoft acquires mobile business intelligence leader Datazen


Credit: blogs.microsoft.com

Initial findings of Microsoft Mobile BI from Datazen

I am fortunate that I did have some time to try and see how easy or difficult it is to get the Datazen up and running. I will admit that I did skim read through the installation document, and from my skim reading it did seem pretty straight forward. The actual installation was rather easy to get the product installed.

It was then when I had to configure it to actually use the product that I once again quickly read the documentation, but I did not find it all that straight forward. But I think it is just to understand how they have developed the product, and follow the process. Even though it said during the installation that for the Active Directory integration you could configure it to point at the Active Directory server and you could then use Active Directory integration, but when I did complete that I then tried to create a domain user, and then log in as that user but it failed and did not work.

I also then had a bit of trouble creating a New Data Connection, when connecting to SQL Server Analysis Services, and when I looked online to try and see what the connection settings are, I could not find much information. I finally got it working by not specifying the Username and Password in the connection string! When did create a new Data Connection for SQL Server that worked perfectly!!

Then when I went to the next step to create a New Data View, I then put in my MDX query, and the Data View that was returned did not return the data as I expected, which was to include all the column information that you get when running an MDX query in SQL Server Management Studio.

SQL Server Management Studio Query Results vs Datazen Data View

Finally I got that working and then tried to use the Datazen Publisher App, which is for Windows 8, it was another new thing to learn on how to create the dashboard and link the data. But to me that is the fun part.

So all in all a mixed reaction to getting it up and running. But it does look really promising!

SQL Server 2014 SP1

Microsoft also announced the release of SQL Server 2014 SP1, and from what I read there are a whole host of bug fixes and updates to SQL Server.

As far as I could tell, there are no new products or significant changes, especially in the Microsoft BI space. It is great that they have SP1 already, which is always good to get all the initial release issues resolved in a Service pack.

You can read about all the details and updates here: SQL Server 2014 Service Pack 1 release information

And to download SP1 here is the link: Download Microsoft SQL Server 2014 Service Pack 1 (SP1)

Power BI (Google Analytics Connector)

And in my final thoughts and findings for this week, I also read up about the new Google Analytics Connector within Power BI.

The busy guys within the Power BI team have created the Google Analytics content pack, and once you have connected to it, it automatically creates a default Dashboard, as well as a whole host of underlying reports.

I personally did try this out, and it honestly took me at most 5 minutes to get it completed and I had all the data available to me and ready to use. The other great thing, is that you can still go and create your own reports and add items to your dashboard as required. So it is not locked down, and not allowing you to customize it!

I think that for certain data connectors this is really a smart move, because it allows people who do not understand the underlying data, to be able to connect to specific data and then interact with the data to start getting an understanding of how they can best utilize their data and enable their business.

Another thing that I also noticed is the way that they have embedded images, as well as created the calculations. While you can do some of this in the current version, I do not think currently you can customize it to the extent that they have. But what it does do is to give us a little insight to what will be coming up in the future!

Here is a screenshot of what I am talking about! And if you can do this already then please let me know!

Credit: www.powerbi.com

Here are the details if you want to read up more about it: Visualize and Explore your Google Analytics data with Power BI

That is it for my first non-technical blog post, I do hope it was an interesting read, and if anyone has any suggestions please let me know on how to improve this or things to have a look at in the comments section!

SSIS – Configuring SSIS Package to run job after data loading has completed

  • In our example below, we are going to be using a SharePoint 2013 Data Alert job which was created in SQL Server Agent, and then insert this into an existing
    SSIS
    Project.
  • The reason for doing this, is so that every time our SSIS Project runs, as part of the process, it can then fire off a SQL Server Job.
  • Essentially in the past the SQL Server Agent Jobs run
    individually and are not tied into when our data has loaded.
  • By doing it in this manner, it enables the related job to be run after every data load. Which then enables the business to get the relevant data at the relevant times.


NOTE: You can modify this for any SQL Server Job.

Find the related SQL Server Agent Job Name

Below details how to find the related SQL Server Agent Job name. As typically when you create a SharePoint Data Alert, or SQL Server Reporting Services (SSRS) Data
Driven Subscription or Email Subscription, it creates the job name with a GUID.

This makes it rather difficult to find the correlating Job Name.

  1. The easiest way to find the SQL Server Agent Job Name, is once you have created your SharePoint Data Alert, or SSRS (Data Driven Subscription or Email Subscription) is to go directly into your SQL Server Agent Job Monitor where the Job was created.
  2. Then open the Job Activity Monitor
  3. Then scroll through the list until you find a job with the following
    properties
    1. The name will be in a GUID format:

    2. The Last Run Outcome is set to Unknown
      1. And the Last Run is set to never

    3. NOTE: If there is more than one job with the above properties, then look to see when you scheduled the start time of your
      job.
      1. If that still does not help you might have to go into the job
        properties and into the schedules to see how often it runs to find the correct job.
  4. If this is in a Test
    environment, you can try and run the job to ensure that you do have the correct job.
  5. Make a Note of the Name of the Job
    1. In our example it was: 68CAE336-3D38-42A6-9526-F32F4D501AA4


Modifying the SQL Server Agent Job

Below are the steps to modify the SQL Server Agent job, so that it will not run on a schedule.

NOTE: The reason we are doing this is because we want the job to be run from within our SSIS Project after it has loaded our relevant data.

  1. Go into the properties of your SQL Server Agent Job and click on the Schedules
    Page

  2. Then in the Schedule
    List
    click on the Schedule and select
    Remove.
  3. Once completed there will now not be any schedules for the job.

  4. Then click Ok.


Creating and configuring your SSIS Package to run the SQL Server Agent Job for you

Below are the steps to create and configure your SSIS package to run the SQL Server Agent Job as part of the SSIS Project.

  1. Create your new SSIS Package.
  2. Drag in an Execute SQL Task
  3. We renamed our Execute
    SQL
    Task to the following:

    Run SharePoint Data Alerts


  4. Then we went into the properties.
    1. We then put in our Connection to our SQL Server Database, which is the same as the where the SQL Server Agent Job is
    2. Then under the SQL Statement we put in the following:

      EXEC msdb.dbo.sp_start_job N’68CAE336-3D38-42A6-9526-F32F4D501AA4′ ;

      1. NOTE: The thing to note here is that we are using the MSDB
        Stored
        Procedure to start our Job.
        1. And that we are using the Job
          name which we noted in previous steps.
  5. Now that you have completed your Execute SQL Task, it is time to test it.
  6. Right click and select Execute SQL Task.
  7. If successful it should come back looking like the following below:

  8. As well as actually getting the email in your Inbox, as is the case with our SharePoint Data Alert.

For SQL Server 2014 – Use the following link below to use an oData Source to get data from SharePoint List into your table

Below are the steps if you want to use SQL Server 2014 to get data from a SharePoint list into your database.

The URL below explains how to download and install the OData Source for SQL Server

1.       Click on the following link below

a.       http://www.microsoft.com/en-us/download/details.aspx?id=42295

2.       Then once you load the page click on Download

a.       This will then bring up which components you want to download.

b.       Scroll down and select the following:

c.        clip_image001

3.       Then download and install the component.

a.       You can just accept all the defaults in the Wizard.

4.       Then if you now open SSDT, and drag in a new Data Flow Task, then click on the Common Section you should see the following:

a.       clip_image002

5.       NOTE: We would want to use the X86 version for our testing in SSDT, due to SSDT being a x86 version.

6.       NOTE II: You will also have to install the component on your SSIS Server and configure your SSIS package to run in 32bit mode, so that when it is run as part of the job in SSIS it will function correctly.

Configuring your OData Source in SSIS

NOTE: You might have to create your SQL Table, to get the data from your SharePoint List into the table before you complete the steps below. Or you can create the table after step 2 below.


1.       Once you have followed the steps above, the one thing to note is how to get the correct URL so that we could create our connection to our Lists

a.       With the example below our URL was:

http://Server/sites/testingdemo

b.       Now in order to get the URL for the lists, we had to put in the following:

                                                               i.      clip_image003

                                                             ii.      NOTE: In your Site, you just need to add the following:

/_vti_bin/Listdata.svc

                                                            iii.      Also ensure the account that you use has access to the SharePoint List.

c.        And then you have your connection completed.

d.       After which you can then select your List from the drop down in your

2.       And then we configured our OData Source with the following:

a.       clip_image004

b.       Under Use collection or resource path, ensure that you select Collection.

c.        Under Collection, click on the drop down, and ensure that you select your SharePoint List that has been created in SharePoint

                                                               i.      In our example it was called: CrimeReportingSubscriptions

d.       You can then click on Preview to see that you are getting the expected data.

e.       Then if you click on Columns you will then see all the SharePoint related columns, as well as the columns from your List

f.         clip_image005

g.       NOTE: Ensure that you do have some data already in your list.

h.       Then click Ok to have your OData Source completed.

3.       Then once completed it will look like the following in your Data Flow

SSRS – Microsoft sql server fitler table/matrix with 2nd row of data

What I wanted to do, was to create multiple table/matrix, but to have them separate. And then to have 5 of them in total. But I wanted to have the top 5. So I wanted the first one to be the top value, then top 2, top 3, top 4 and top 5.

This is what the result looks like:

clip_image002[5]

1. Create your first table/matrix which will be filtered as shown below:

a. clip_image004[5]

2. Then copy and paste your first table/matrix and complete the filter like this to show ONLY the second one or top 2

a. clip_image006[5]

b. The thing to note here is that for the Top N value I put 2

c. And then for the Bottom N I put 1

3. Then to do this for the third or top 3, do the following:

a. Copy the above table/matrix and complete the filter as follows:

b. clip_image008[5]

c. The thing to note here is that the Top N was changed to 3

4. NOTE: For any additional table/matrix change the top N to the value you want.

SSAS – KPI’s – Example of creating a KPI

Based on the previous BLOG post <font color="#ff000, we are going to explain how to create a KPI


Example

·         Using our Internet Sales cube, we want to create a KPI in order to see if the guys are meeting their new target which is a 10% increase from their current sales.

·         So we will create a new KPI with the following:

o    The KPI Goal will be 10% greater than the current sales

o    The KPI Status will be if the KPI value is 100% greater than the KPI Value.

o    The KPI Trend will be based on the Previous Value selected from your Date Dimension using the Calendar Hierarchy


You can get a copy of this here: http://msftdbprodsamples.codeplex.com/releases/view/55330

·         I used the AdventureWorksDW2012 Data File and AdventureWorks Multidimensional Models SQL Server 2012


NOTE: We are using SQL Server 2014, and SSDT for Visual Studio 2013


1.       Go into the Adventure Works cube.

2.       Click on the KPIs and then select New KPI

a.        clip_image002

3.       Next we will give the KPI the following name and associate it to our Internet Sales Measure group

a.        clip_image004

4.       Now we will configure our Value Expression, which as per our example will be the Internet Sales amount

a.        clip_image006

5.       Next we will configure our Goal Expression which will be 10% greater than our Value Expression

a.        clip_image008

b.       NOTE: Due to using SSDT, the syntax is the following for the above:

Format([Measures].[Internet Sales Amount]*1.1,”$#,##0;($#,##0)”)

c.        NOTE: Because we are using a currency we formatted our Goal Expression so that when it displays it will display correctly.

6.       Next is the Status details.

a.        First what we did was to change the Status Indicator to a Shape as shown below:

b.       clip_image010

c.        NOTE: The reason that we did this, is so that when it is displayed in Excel you can see it easily based on the Shape Colour.

d.       Then for the Status expression we configured it with the following:

e.       clip_image012

f.         Here is the text below if this is not clear enough:

Case

    When KpiValue( “Internet Sales Growth” ) / KpiGoal( “Internet Sales Growth” ) >  1

    Then 1

    When KpiValue( “Internet Sales Growth” ) / KpiGoal( “Internet Sales Growth” ) <= 1

         And

         KpiValue( “Internet Sales Growth” ) / KpiGoal( “Internet Sales Growth” ) >= .85

    Then 0

    Else -1

End

g.        What we have done in the above Status expression is that if the growth is greater than 100% when comparing the Value to the Goal, then make the expression 1, which will make it green.

h.       What we have done in the above Status expression is that if the growth is less than 100%  but greater than 85% when comparing the Value to the Goal, then make the expression 0, which will make it yellow.

i.         Else it will be less than 85% in which case make it -1, which will make it red.

7.       Then for the Trend section we did the following:

a.        We changed the Trend indicator to the Status arrow.

b.       clip_image014

c.        NOTE: We did this so that when it is displayed in Excel it will display correctly.

d.       Then for the Trend Expression we configured it with the following:

e.       clip_image016

f.         Here is the text below if not clear enough

Case

    When (KPIValue(“Internet Sales Growth”),[Date].[Calendar].CurrentMember) >

         (KPIValue(“Internet Sales Growth”),[Date].[Calendar].CurrentMember.PrevMember)

    Then 1

    When (KPIValue(“Internet Sales Growth”),[Date].[Calendar].CurrentMember) <

         (KPIValue(“Internet Sales Growth”),[Date].[Calendar].CurrentMember.PrevMember)

    Then -1

End

g.        NOTE: What we are doing above is we are taking the KPI Value and comparing it to the previous member in our Date.Calendar Hierarchy.

                                                                i.      The reason with using the Date.Calendar Hierarchy is that we can use any member or part of the hierarchy, it will then compare that to the previous value.

1.       EG: If you use quarter it will compare quarters. Or if you compare Month it will then compare months.

h.       If it is better than the Previous then make the trend 1 or Green Arrow.

i.         If it is worse or lower than the previous, then make the trend -1 or Red Arrow.

8.       Now if you process your cube and view the results in Excel it will look like the following for July 2005, where we are using the Date.

a.        clip_image018

SSIS – Error Handling and Error emailing for Packages

What the steps below do is to handle error handling for your SSIS packages. And then within the error handling enable it so that you can email the exact error to email addresses so that they are notified when there is an error and what the error was.


Example:

·         In our example we are going to be using a package named: SSAS-DroppingPartitions

·         This is what will be referenced below.


Enabling Error Handling in an SSIS Package

1.       Open your SSIS Package

2.       Then click on Event Handlers at the top.

3.       Then click on:

a.        Click here to create an ‘On Error’ even handler for executable ‘Package Name’

b.       EG

                                                               i.      Click here to create an ‘On Error’ even handler for executable ‘SSAS-DroppingPartitions’

                                                              ii.      clip_image002[8]

4.       Now you will see that your package should have the following at the top.

                                                               i.      clip_image004[8]

5.       Now your package is ready for specific event Handlers to be added.

6.       Below is what it will look like with the Event Handler Enabled

Enabling your package error to be emailed

Adding an SMTP – Connection Manager for the Send Mail Task

1.       The first thing that you need to do is to setup a new connection which will enable you to send the actual emails by doing the following below.

2.       Right click in the Connection Managers window and select the following:

a.        New Connection.

3.       Then click on:

a.        SMTP Connection manager for the Send Mail task

4.       Then click Add

5.       This will then open the SMTP Connection Manager Editor Window and you will need to fill in the following:

a.        Name:

                                                               i.      SMTP-Mail.Mailserver.com

                                                              ii.      NOTE: This is the name of our mail server which we are sending the email.

b.       Description:

                                                               i.      SMTP-Mail.Mailserver.com

c.        SMTP Server

                                                               i.      Mail.Mailserver.com

                                                              ii.      NOTE:

1.       This is the actual DNS address for your SMTP Server

d.       Tick

                                                               i.      Use Windows authentication.

                                                              ii.      NOTE:

1.       This is because in our current setup the mail server requires Windows Authentication in order to send out emails.

e.       Then click Ok.

6.       Now you will see your SMTP connection in your connection manager’s window.

7.       clip_image002[4]


Adding the Send Mail Task and configuring the Send Mail Task

1.       What we are going to do is to configure the send email task to send email to the people who require the email. And then configure what gets send out as part of the email.

2.       Click in the Toolbox and drag the Send Email task into your Event Handler Window

3.       Right click on the Send Mail Task and click on Edit

4.       Under General put in the following for the Name and Description

a.        Send email if Task Fails

5.       Then click on Mail in the left hand side.

a.        Where it says SmtpConnection click on the drop down and select the SMTP connection that you created in the section called Adding an SMTP – Connection Manager for the Send Mail Task above.

                                                               i.      EG:

                                                              ii.      SMTP-Mail.Mailserver.com

b.       Where it says From:

                                                               i.      This must be a valid FROM address that the mail server receiving the required email to relay will accept.

                                                              ii.      EG:

1.       user@domain.com

2.       NOTE: In some mail server setups you will have to ensure that the from email address is allowed to replay via your mail server.

c.        Where it says To:

                                                               i.      This is to whom you want to send the emails to.

1.       usertoemail@domain.com

                                                              ii.      Where it says Subject I put in the following:

                                                            iii.      SSIS Error: Package Name

                                                            iv.      EG:

1.       SSIS Error: SSAS-DroppingPartitions

d.       Where it says MessageSourceType this must be left as the default which is:

                                                               i.      Direct Input

e.       We will configure the Message Source in the next step.

f.         So once complete for now it will look like the following:

g.        clip_image004[4]

6.       Next is where we are going to dynamically input our error message and details per SSIS package using System Variables and expressions.

7.       To configure the Message Source type click on the Expressions in the left hand side.

a.        Click on the plus sign next to Expressions

b.       Then click on the Ellipses button, this will open the Property Expressions Editor

                                                               i.      Click under Properties and click on the drop down button.

                                                              ii.      Select the following:

1.       Message Source

                                                            iii.      Then once again click on the Ellipses button.

c.        This will open the Expression Builder

d.       Now this is where you will add the following into your Expression builder, an explanation will be below.

“Package:                              “+ (DT_WSTR, 50)  @[System::PackageName] +”.

Time:                                      ” + (DT_WSTR, 50) @[System::StartTime]  +”.

Task:                                       “+  (DT_WSTR, 50) @[System::SourceName]  +”.

Error Description:                ” + (DT_STR, 2000,1252)  @[System::ErrorDescription]

                                                               i.      NOTE: If you want to format your text, use Notepad and then copy and paste it from notepad into your Expression Window.

e.       What the above does the following:

                                                               i.      It starts with the Package name

1.       And then the package Name variable.

                                                              ii.      Then it is the time of the error

1.       And then the StartTime variable.

                                                            iii.      Next is the Task Name

1.       With the TaskName Variable

                                                            iv.      Finally is the Error Description

1.       With the ErrorDescription variable

2.       NOTE: Because the error is text you have to change the data type from the default which is DT_WSTR to DT_STR

a.        With this you then need to add the length and then also the code page

                                                                                                                                       i.      In our example which works is the code page 1252

f.         Then click on Evaluate Expression

                                                               i.      This should then come back with the expression in the Expression Value window above the Evaluate Expression button.

                                                              ii.      Below is what the Expression looks like

                                                            iii.      clip_image006[4]

                                                            iv.      Click Ok.

g.        Now to add an expression for our subject click on Property drop down in the Property Expressions Editor.

                                                               i.      Select Subject

1.       Then once again click on the Ellipses button.

                                                              ii.      This will open the Expression Builder

                                                            iii.      Now this is where you will add the following into your Expression builder, an explanation will be below.

“SSIS Error: ” +  (DT_STR, 50,1252)  @[System::PackageName]

1.       What this does is just takes the Package Name and puts it into the subject line in our email.

h.       Then click on Evaluate Expression

                                                               i.      This should then come back with the expression in the Expression Value window above the Evaluate Expression button.

                                                              ii.      As shown below is what it looks like

                                                            iii.      clip_image008[4]

i.         Then click Ok 3 times to get out of the Send Mail Task Editor.

8.       Once complete it will look like the following:

a.        clip_image010[4]

b.        


Testing your Send Mail Task

1.       The final step is to test to make sure that the Send Mail task works.

a.        NOTE: I would only do this for the first Send Mail task, because if this works it should work for all other packages as well.

2.       Go into your Control Flow and deliberately change a task so that it fails.

a.        NOTE: In our example I changed an Execute SQL task, and then change the Stored Procedure name so that I knew it would fail because the Stored Procedure does not exist.

3.       Once you have saved your change then run the package in Debug mode.

4.       When the package runs it will FAIL which is what we want.

a.        Now if you go and look in the Event Handlers Window you should see your Send email if Task Fails as green.

b.       clip_image012[4]

5.       You should also receive the email with the error as you configured above.

Relocating to Australia – BI Job opportunities in Queensland

I thought I would let you guys know that I am about to relocate to Australia from South Africa. I have had an amazing time in South Africa, and learnt a whole lot whilst working at my past employer.

So this is a plug at anyone who has any lead or potential BI work in Queensland, Australia. I would really appreciate it, if you have anything to please email me.

I will be in Australia from 08 August 2014.

Below is a link to my CV and as well as my contact details.

CV-Gilbert Quevauvilliers-2014

Thanks

Gilbert

SQL Server Analysis Services (SSAS) – Updating Project with Partition information

I am sure that this has happened to someone else before. You are making a change to your SSAS cube, within your SSAS cube you have created your initial partitions. But on your production server you have programmatically added additional partitions. Now by mistake or just not thinking you deploy your project, and when it prompts to overwrite your current database, you click YES.


Now your production SSAS cube has all the wrong partitions. SO then you have to go about creating them again and processing them again.


So below are the steps that I do, before I make changes to my SSAS project, so that if I happen to deploy it by mistake I will not have to recreate the partitions. You will still have to process them again, but it does save the hassle of having to re-create them all.


Example:

·         Our current Internet Sales Partition has the following partitions created on our Production Server

o    clip_image002

·         We are going to manually create a new Partition called:

o    Internet_Sales_2009

·         Then we are going to go through the manual steps to get this partition information into our existing SSAS Project.

o    So what when we are finished we will see our Internet_Sales_2009 Partition within our SSAS Project.

o    Currently the Project looks like this:

o    clip_image004


You can get a copy of this here: http://msftdbprodsamples.codeplex.com/releases/view/55330

·         I used the AdventureWorksDW2012 Data File and AdventureWorks Multidimensional Models SQL Server 2012


NOTE: We are using SQL Server 2014, and SSDT for Visual Studio 2013


Creating new Partition on Server

1.       What we did was to script out our current partition and then modify it to create one for the year 2009

2.       Below is a snippet of where we made the changes

a.        clip_image006

3.       Once we ran this we then could see our Partition for the year 2009

a.        clip_image008


Creating new SSAS Project and importing SSAS Database

In the steps below we are going to create a new SSAS Project and then import our SSAS database into our Project.


1.       Within SSDT we are going to create a new Project with the following:

a.        clip_image010

2.       Give your project a name.

a.        As with our example we gave it the name of Adventure Works – Production Import

3.       This will then start the Import Analysis Services Database Wizard

a.        Click Next on the first screen

4.       On the Source Database screen put in the details to your Server and select your database as with our example shown below:

a.        clip_image012

b.       Click Next

5.       This will then import everything from your server.

6.       And once complete it will look like the following below:

a.        clip_image014

b.       Click Finish

7.       If you now go to our Adventure Works Cube, click on Partitions you should see the following under the Internet Sales Measure Group

a.        clip_image016

8.       When it first loads it does not update the Adventure Works.partitions file

9.       You need to do the following to put the XML data into the Adventure Works.partitions file

a.        Click on Build and then Build Adventure Works – Production Import

b.       Once this is done you will then see that your Adventure Works.cube has an asterix and needs to be saved:

c.        clip_image018

d.       Click Save.

10.    Now you can verify that your Adventure Works.partition file has the information within the file by its file size:

a.        clip_image020

11.    Now you can close this project down.


Changing the Partition information on our current SSAS Project

What we are going to do below is to now take the information from our project we created above (Adventure Works – Production Import) and put swop out the partition file so that when we open up our current SSAS Project it will then reflect the additional partition, (Internet_Sales_2009)


1.       Go to the location where your current SSAS Project is.

2.       Then make sure you go into the details where you can actually see all your project files.

3.       IN our example it would be in the following location:

a.       C:\Users\DomainUser\My Documents\Projects\Adventure Works DW 2012\Adventure Works DW 2012

4.       And it will look like the following:

a.        clip_image022

b.       NOTE: You will see above the partition information stored in the Adventure Works.partitions

c.        NOTE II: Every cube that you create will always have a .partitions file, even if you have not created any partitions

5.       Now rename your Adventure Works.partitions file to Adventure Works.partitions.Backup_20140723

a.        NOTE: This is so that we know when we made the change.

b.       It will now look like the following:

c.        clip_image024

6.       Now go the location where you created your Import project (Adventure Works – Production Import)

7.       In our example it would be in the following location:

a.       C:\Users\DomainUser\My Documents\Projects Adventure Works – Production Import\Adventure Works – Production Import

b.       In this folder copy the Adventure Works.partitions file

c.        NOTE: You will see it should be larger than our screenshot in step 4 above:

d.       clip_image026

8.       Now go back to your folder location of your current SSAS Project. (which we have in step 3 above)

a.        Then paste the Adventure Works.partition file into the folder.

b.       NOTE: You should be able to paste it without any issues due to renaming the current partition file in step 5

9.       Now open your current SSAS Project and see when you go into the Adventure Works.Cube and go to Partitions if you can see the new partition.

a.        clip_image028


Now if by mistake you do deploy your project at least the cube information is up to date.