I came across Chris Webb’s excellent post (Creating Current Day, Week, Month And Year Reports In Power BI Using Bidirectional Cross-Filtering And M) in which he demonstrated how to leverage the Bi-Directional filtering in Power BI. Chris goes into great detail to explain how he goes about creating the functions, tables and how it all pieces together.
This got me thinking and I came up with a way to have both Fiscal or Calendar Date Slicers in Power BI. So in the steps below I will show you how I extended on what Chris Webb did, to make things easier. As well in a later blog post to leverage the Fiscal or Calendar dates for when displaying Month names on a chart visual.
I then had the opportunity to present at the Power BI User Group in Brisbane and below is what I presented to the people who attended.
Below is an example showing how it dynamically switches between the Fiscal and Calendar Months. The thing you will notice is how the Month Names change when changing from LY to LY Fiscal. Which dynamically switches between the Fiscal and Calendar Months.
NOTE: Please click on the GIF below if it is too small to see what is happening.
Part 1 – Starting with the default Calendar Dates from Chris Webb’s blog post
The first thing that I did was to download the workbook example from the blog post, which you can also download from here DynamicDateSelections.pbix
This is a quick overview in terms of what was detailed in Chris Webb’s blog post.
Creating the Function in Power Query
The first explanation is how Chris created the function in Power Query.
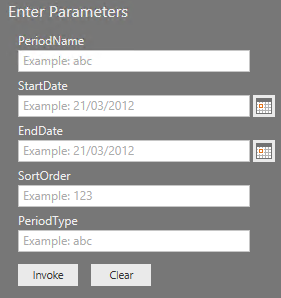
I start with the function first which is shown below. This is the function that requires the parameters below, and in turn creates the Period table.
As you can see above it requires the following parameters, Period Name, Start Date, End Date and Sort Order which are explained below:
-
Period Name is for the Date range for the Period
-
Start Date is for the start date for your Period (YTD)
-
End Date is for the end date for your Period (YTD)
- EG: If today’s date is 06 Sep 2016 the End Date would be 06-09-2016
- Sort Order is how you want to sort our Periods
Creating the Period Table in Power Query
Next is the actual code that will generate the values to be passed through to the function. Which in turn will create the period table.
Below is a simple example of the Power Query Code “M” which has to examples for Today’s Date, and YTD
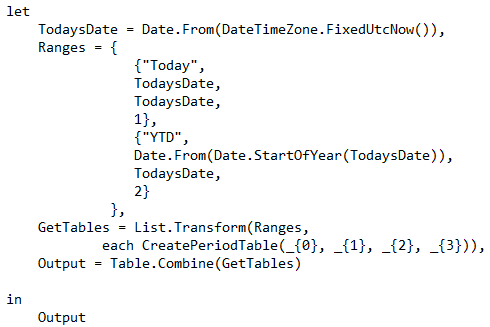
What is happening above is the following
-
First it is getting Todays Date
- With this example Todays Date will be 06 Sep 2016
-
Next is where it is defining the range of dates
- This is where you can define all of your periods.
- As with our example I have only shown 2 above.
-
Then within the range is where I am putting in the required parameters for the function above as explained below using the YTD example
-
The function first Parameter called
Period Name
- So with our YTD this is shown above with

-
Next the second
Parameter is called Start
Date which is where I get the first date of the year, using the inbuilt Power Query formula
-
The third parameter is called End Date, which is where I get todays Date

- So this will be 06-09-2016
-
And the final parameter is the Sort Order, which is the order that it will be shown.

- So this is saying it will be shown second.
-
Then it then using the Power Query Formula to get a list from the range and pass it to the CreatePeriodTable function, and output that into the GetTables

- The
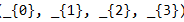 refers to the parameter values from within the range.
-
And then finally it outputs the data and combines it all into one table.
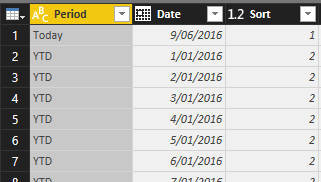
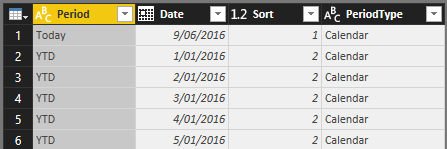
So once the above is done this is what table looked like:
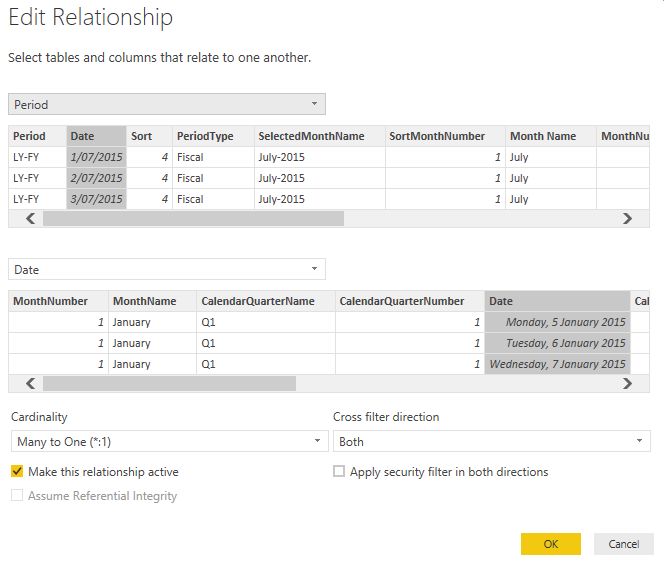
NOTE: Relationship between Period and Date Table
I just wanted to make a quick note, that as per Chris’s blog post there is already the relationship defined between the Period and Date table as shown below:
Part 2 – Extending the Function & Period Table to cater for Fiscal or Calendar Dates
In this next section below I am going to explain how I extended both the function and the Period table to cater for if it is a fiscal or calendar date.
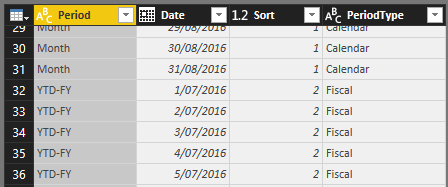
Below is what the final output looks like in the Period Table
Extending the Function
What I did was to extend the function to accept one more parameter which is the Period Type.
So below is the actual code that I modified in the Advanced Editor in Power Query
(
PeriodName as text,
StartDate as date,
EndDate as date,
SortOrder as number,
PeriodType as text
) as table =>
let
DayCount = Duration.Days(EndDate-StartDate)+1,
DateList = List.Dates(StartDate,DayCount,#duration(1,0,0,0)),
AddPeriodName = List.Transform(DateList,
each {PeriodName,_,SortOrder,PeriodType}),
CreateTable = #table(
type table[Period=text, Date=date, Sort=number,PeriodType=text],
AddPeriodName)
in
CreateTable
As you can see above I added the Period Type as required, it is highlighted in RED above.
So when complete and looking at it in Power Query it now has the additional parameter
Extending the Period Table
Now in order to extend the period table I needed to add in the additional parameter as shown below:
let
TodaysDate = Date.From(“06-09-2016”),
Ranges = {
{“Today”,
TodaysDate,
TodaysDate,
1,
“Calendar”},
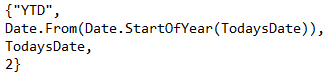
{“YTD”,
Date.From(Date.StartOfYear(TodaysDate)),
TodaysDate,
2,
“Calendar”}
},
GetTables = List.Transform(Ranges,
each CreatePeriodTable(_{0}, _{1}, _{2}, _{3},_{4})),
Output = Table.Combine(GetTables)
in
Output
So now when you see the Period table it looks like the following:
Part 3 – Adding in Parameters for Fiscal Start and End Months
In this section what I did to make it easier was to add in parameters for the start and end fiscal months.
As well as modify the underlying Power Query M code, to take this into account.
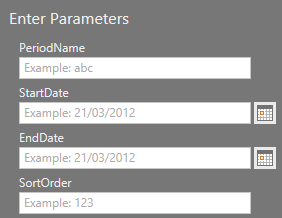
Creating the Parameters
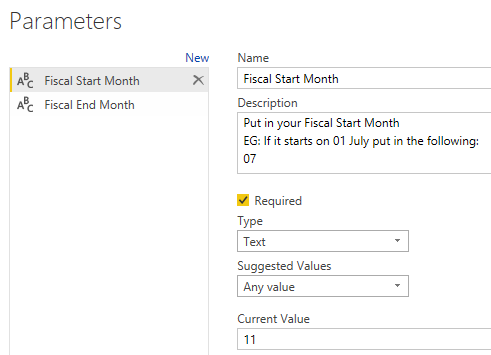
I created the following 2 Parameters as shown below:
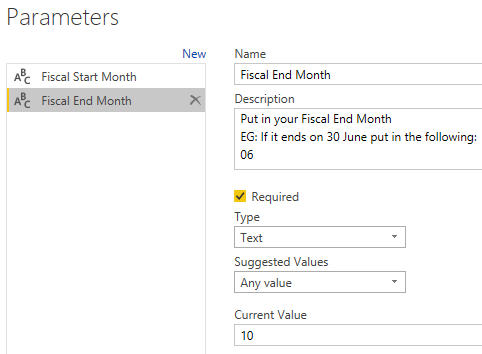
Modifying Power Query M Code for Parameters
Next is where I added the following into the Power Query M code, so that it would be dynamic in terms of always using the correct Fiscal start and end months.
Below is the code and an explanation of what I did.
The reason for doing it this way, is that I have now defined it once and can re-use it anywhere else within my Power Query M Code.
let
TodaysDate = Date.From(DateTimeZone.FixedUtcNow()),
YearText = Number.ToText(2000),
FiscalStartMonth = Date.Month(Date.FromText(“”&YearText&”-“&#”Fiscal Start Month”&“”)),
FiscalStartMonthDay = Date.Day(Date.StartOfMonth(Date.FromText(“”&YearText&”-“&#”Fiscal Start Month”&“”))),
FiscalEndMonth = Date.Month(Date.FromText(“”&YearText&”-“&#”Fiscal End Month”&“”)),
FiscalEndMonthDay = Date.Day(Date.EndOfMonth(Date.FromText(“”&YearText&”-“&#”Fiscal End Month”&“”))),
Using the Values within my Period formula for Fiscal Dates
In this section below I will explain how I then created periods for Fiscal Dates.
The example below that I am going to show is for Fiscal Year – Last Year (FY-LY)
{“FY-LY”,
if Date.Month(TodaysDate) < FiscalStartMonth then #date(Date.Year(Date.AddYears(TodaysDate,-2)),FiscalStartMonth ,FiscalStartMonthDay) else #date(Date.Year(Date.AddYears(TodaysDate,-1)),FiscalStartMonth ,FiscalStartMonthDay),
if Date.Month(TodaysDate) < FiscalEndMonth then #date(Date.Year(Date.AddYears(TodaysDate,-1)),FiscalEndMonth ,FiscalEndMonthDay) else #date(Date.Year(Date.AddYears(TodaysDate,+0)),FiscalEndMonth ,FiscalEndMonthDay),
3,
“Fiscal”},
- The first line is our Period Name “FY-LY”
-
Next is where I get the starting Period for our Fiscal Year for Last Year (01-07-2015)
-
As you can see above I have put in an if statement, in which I can validating todays Month Number, and if it is less than the FiscalStartMonth Then go back
2 years, else go back 1 year
- So for example if our Fiscal Start Month is July, the number will be 07.
- So if today’s date is 06-09-2016, that means the Month number
currently is 09
- So based on the above, this is NOT
true, so only go back One Year.
- NOTE: You can see that because I am defining the #Date, I have to use the required format (YEAR,MONTH NUMBER,DAY) EG: #Date(2015,07,01)
-
Now I did the same for the Ending Period, but this time I changed it to use the FiscalEndMonth
- NOTE: You can see that because I am defining the #Date, I have to use the required format (YEAR,MONTH NUMBER,DAY) EG: #Date(2016,06,31)
- And then the final part is where I put the Period Type as “Fiscal” which will be explain further down below.
- This ensures that I now get the correct Period Range for Fiscal Year Last Year.
Adding additional Period into the Period table.
In the steps below I am going to add the following period “Calendar Year – Last Year – Previous Quarter” (CY-LY-PQ)
What this means is that if the current date is 06-09-2016 then the range for CY-LY-PQ would be: April 2015 – June 2015
,
{“CY-LY-PQ”,
Date.AddYears(Date.AddQuarters(Date.StartOfQuarter(TodaysDate),-1),-1),
Date.AddYears(Date.AddQuarters(Date.EndOfQuarter(TodaysDate),-1),-1),
5,
“Calendar”}
- What we are doing above is to get our Date ranges that we needed.
So now you can then load this table and close down the Power Query Editor, which will then load the data into your model.
And the reason for this is so that when you select an item from the Period Table it will flow via the Date table to the fact table.
Part 4 – Adding the Period Slicer and how it works
In the steps below I will show how to add the Period slicer and when selected how it changes the data dynamically.
-
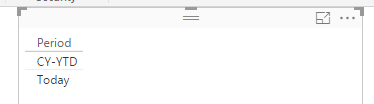
Navigate to the Period table and then select the Period on the report canvas as shown below.
-
Then under the Visualizations change it to the Slicer
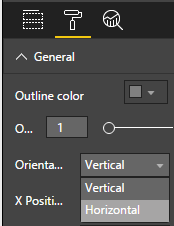
-
Then go into the Format and under General, change the Orientation to Horizontal
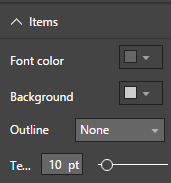
-
And then I formatted it under Items as shown below.
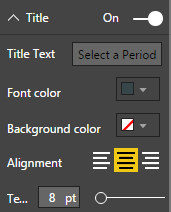
-
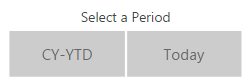
And then finally I turned the Header Off and gave it the following Title
-
So that once complete it looks like the following below.
- Now when you select a Slicer your values will change dynamically.
NOTE: The thing to NOTE is that when you change between Fiscal and Calendar Periods the Months are not sorting correctly.
Part 5 – Adding Dynamic Months based on Fiscal or Calendar Periods
So in this step we are going to be creating a new calculated column so that if the period selected is Fiscal based, then it must use the Fiscal Month Names. And likewise if the period selected is Calendar based then use the Calendar Month Name.
We will also be adding the Month Sort Order so that it will be sorted correctly.
Creating the Month Name calculated Column
The first calculated column to add is the Month Name.
-
So what I did was to create a calculated column with the following DAX syntax, with an explanation afterwards.
Month Name =
IF (
[PeriodType] = “Calendar”,
RELATED ( ‘Date'[MonthName] ) & ” “,
RELATED ( ‘Date'[Fiscal Month] )
)
-
I am starting my DAX Calculated Measure with an IF statement highlighted in GREEN
- The reason for using the IF statement is so that I can use it to decide if a value is True what to do, and if false then what to do.
-
Next is where I am specifying what to do if the Period Type = “Calendar” highlighted in LIGHT BLUE
-
Next is where I am specifying the FALSE portion of the IF Statement highlighted in ORANGE
- NOTE: I do not need to next any more IF statements because my data has either Fiscal or Calendar.
- And in this syntax I am getting the related Date Fiscal Month Name.
- NOTE: The reason for this is because in the next steps is where I want to sort the Month Names and in order to this I need a unique Source Column in order to do this.
- Now once that is done I could then see my Month Name
column.
Creating the SortMonthNumber calculated Column
-
Now the critical part in order to show the correct dates is to have it in the correct sort order.
- So with our example we want Calendar to be from Jan – Dec
- And we want Fiscal to be from Jul – Jun
-
So I created the following calculated column with the following DAX syntax, with an explanation afterwards.
SortMonthNumber =
IF (
[PeriodType] = “Calendar”,
RELATED ( ‘Date'[Calendar Month Number] ),
RELATED ( ‘Date'[Fiscal Month Number] )
)
-
I am starting my DAX Calculated Measure with an IF statement highlighted in GREEN
- The reason for using the IF statement is so that I can use it to decide if a value is True what to do, and if false then what to do.
-
Next is where I am specifying what to do if the Period Type = “Calendar” highlighted in LIGHT BLUE
- And here is where I am getting the related Date Calendar Month Number.
-
Next is where I am specifying the FALSE portion of the IF Statement highlighted in ORANGE
- NOTE: I do not need to next any more IF statements because my data has either Fiscal or Calendar.
- And in here I am getting the related
Date
Fiscal Month Number.
- This will then create my SortMonthNumber
calculated
column.
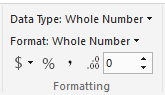
-
Next I ensured that the formatting was set to Whole Number as shown below.
-
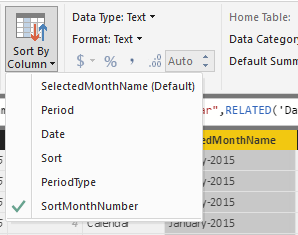
And the final step was to now use this column for the Sort by Column for our Month Name
calculated
column we created above by configuring it as shown below:
-
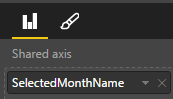
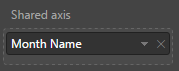
Now all that I did was to change the Month used in my visual from the Date Table and the Month Name
column to the Period Table and the Month Name column
- And then when I clicked on my Slicer I got the expected
results, as shown at the start of the post.
Changing the Month on the Visual
Now the next step is to change the bar chart from the Date Month, to the Month Name in the Period table.
Part 6 – Creating Period Measures easily
The final part is to show how easy it is to create measures using the Period ranges.
NOTE: Ideally you should already have your Periods created in your Period table.
So below I am going to show how to create the following Calculated Measures below
-
The first is to create a measure for Calendar Year – Last Year with the syntax below.
Sales CY-LY =
CALCULATE ( [Sales], Period[Period] = “CY-LY” )
- As you can see what I did below was to use the Calculate and then filter it by the Period Name where it is “CY-LY”
-
The second is to create a measure for Calendar Year – YTD with the syntax below.
Sales CY-YTD =
CALCULATE ( [Sales], Period[Period] = “CY-YTD” )
- As you can see what I did below was to use the Calculate and then filter it by the Period Name where it is “CY-LY”
- Now I can use that as any calculated measure.
Now drag this into your report and show them how it works.
Create the following visual for this below:
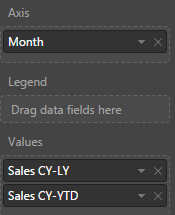 NOTE: That is the Date Month
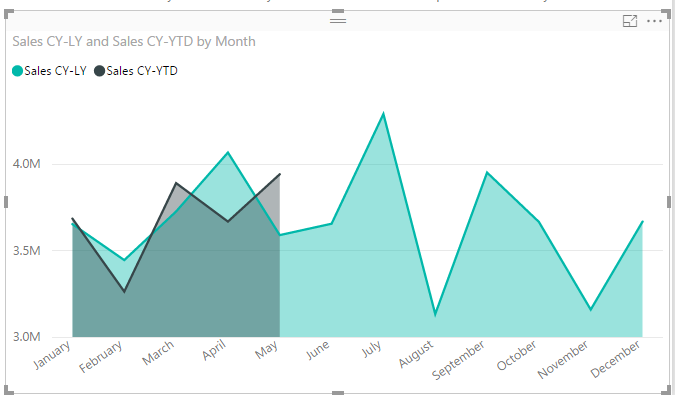
As you can see above we now have a comparison between Last Year (LY) and Year to Date (YTD)
You can download the example file here: World Wide Importers – Power BI – Completed.pbix
As well as if you want to view it on the Web here is the Publish To Web Version: Publish to Web | World Wide Importers – Power BI – Completed
If there are any comments or questions, please leave it below.


 below, it appears to me that your ONLY option is to put in a value.