BI-NSIGHT – Power BI (SSRS mid 2017, Mobile Apps Update, OkViz Custom Visuals Updates) – SQL Server vNext (Get Data Experience,

Whilst last week there was not a lot of news in BI, Microsoft has been releasing some information which does make it feel like Christmas in the area of BI!

Power BI – SSRS Mid 2017

This was really some welcome news especially for the people who use SQL Server Reporting Services (SSRS) and are looking to use the Power BI Capabilities for their On-Premise data.

From the blog post, it does appear that there will be a Technical Preview from what I can understand you will be able to download targeted for January 2017.

Along with that they are looking to start with adding features for Custom Visuals, additional data connectors and Power BI Mobile apps viewing.

And finally targeting the Production ready version in mid-2017, which is fantastic.

You can read the details here: Power BI reports in SQL Server Reporting Services: Feedback on the Technical Preview

Power BI – Mobile Apps Update

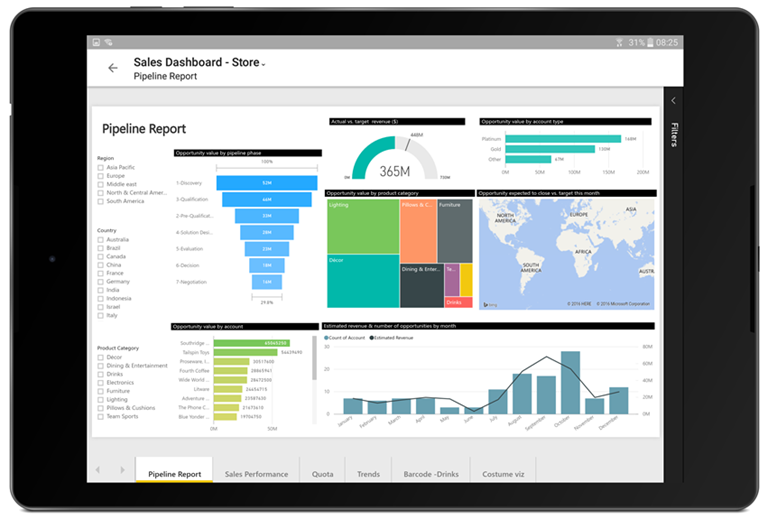
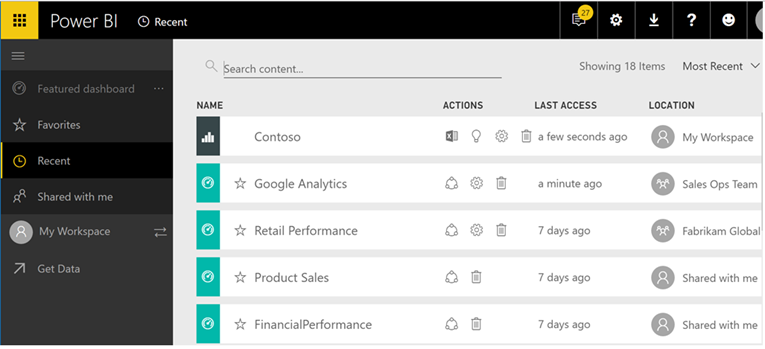
Just in time for the holiday period some nice updates to the Power BI Mobile app.

As with the image above you can now annotate and share what you want to explain via the iOS app a lot easier. As well as using a QR code to get access to dashboards.

Also they have added GeoFiltering for Android, Custom URL on an Image Tile for iOS and Android and they have also adjusted the offline background refresh so that it will consume less data.

You can find the details here: Power BI mobile apps feature summary – December 2016

OkViz – Custom Visual Updates

The guys from OkViz have released to new Custom Visuals which are the Candlestick and the Color Helper. I do think that often we forget about Color Blind people and this visual is a great way to assist them.

OkViz has also updated all their other existing Custom Visuals, which in the past were missing some key features such as tooltips in some of them.

You can find the custom visuals here: okviz.com

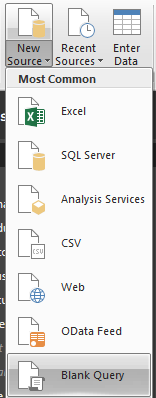
SQL Server vNext – Get Data Experience

This announcement really excites me, having worked in Power Pivot and then Power BI since its inception and now to see this coming into the next version of SQL Server is really amazing.

To me it is a natural progression, and having worked exclusively in Power BI for a few months now I have learnt a great deal, but also have found that things that were traditionally very hard to do in the past are now extremely easy or easy work arounds to shape and get your data in a format that makes for great analysis.

And to see this coming to SQL Server Analysis Services means that I can now leverage all my knowledge when this comes available. Which means that large organizations who have not been able to take advantage of this now can. As well as to have all the data hosted on premise for those that require it.

As I am sure you can understand it will start out with some limited functionality, but this is still a SQL Server vNext, and with each iteration more features will be added.

You can find all the details here: Introducing a Modern Get Data Experience for SQL Server vNext on Windows CTP 1.1 for Analysis Services

SQL Server vNext – CTP 1.1 now available

It is also great to see that there is another version for SQL Server vNext just before Christmas. And there are a whole host of updates.

Firstly details around what is coming in Analysis Services Tabular models, which I have highlighted above with the Get Data Experience, as well as drill-down to established data, which is often what people request. As well as ragged hierarchies and finally enhanced security for tabular models where they are looking to give you the ability to set permissions on individual tables and more granular security!

As well as enhancements for SQL Server on Windows and Linux, which makes it easier to use SQL Server, as well as no doubt perform better.

The blog post details are here: SQL Server next version Community Technology Preview 1.1 now available

Power BI (DAX) – Quick Tip – How to count how many items are selected on a Slicer

Update: 16 December 2016 (I got a comment from Marco Russo, who suggested that can use the FILTERS DAX Syntax which will “Return a table of the filter values applied directly to the specified column.” As well as this should also be faster. I am all about the speed!

I was working on a Power BI Project and one of the requirements for a rather complex DAX calculation was to know how many items the user had selected for the Fiscal Year in the Fiscal Year Slicer, which would then determine which Calculated Measure to use.

The trick here is that I wanted the count to be shown correctly in the Row Context. So that the count of items selected in the Slicer is on EVERY row.

What I mean by this is you can very easily get a count by using a Distinct Count which I can show below.

As you can see above it is counting it once for each row, which is correct when using the Distinct Count.

But what I was required to do, was to have the 8 being shown on every row. But if I deselected Fiscal Year 2011, I wanted it to change to 7 across the rows.

I think that this is something that will be really useful as well as allow me to use the count to dynamically use Calculated Measures.

Example:

  • I am going to be using my Fiscal Date from my Date Table as a Slicer.
  • I am then going to get a count of the rows, and show the total rows on each row.

Solution

Below is the DAX Syntax as well as an explanation of what it is doing.

  • Original DAX Syntax

    ZCALC – Fiscal Year V1 =

    CALCULATE (

    CALCULATE (

    DISTINCTCOUNT ( ‘Date'[Fiscal Year] ),

    ALLSELECTED ( ‘Date'[Fiscal Year] )

    ),

    ALLSELECTED ( ‘Date’ )

    )

  • Updated and Improved DAX Syntax

    ZCALC – Fiscal Year V2 =

    CALCULATE (

    COUNTROWS ( FILTERS ( ‘Date'[Fiscal Year] ) ),

    ALLSELECTED ( ‘Date’ )

    )

  • The trick here is that I first get a count of the rows based on what has been filtered in my ‘Date'[Fiscal Year] column highlighted in LIGHT BLUE

    COUNTROWS ( FILTERS ( ‘Date'[Fiscal Year] ) ),

    • So what I am doing here is to get the count of rows for what has been Filtered.
  • Then what happens with the outer CALCULATE is that it now takes the totals and breaks the Date Filter Context on the rows and using the ALLSELECTED applies it to each row.
  • So what you now get is the following when all the dates are selected for 8 years
  • And then if I have to deselect Fiscal Year 2011, which now makes it 7 Years selected I now get 7 in each row

As you can see this is very handy and can be used a variety of ways.

DAX for your data

If you want to apply this DAX pattern to your data this is how you can achieve it.

If you have all your data in one table called “My Data” and you have a slicer called “Type” you can change the DAX syntax to the following.

Type Slicer Count =

CALCULATE (


COUNTROWS ( FILTERS ( ‘My Data‘[Type] ) ),

ALLSELECTED ( ‘My Data‘ )

)


  • What you need is to change the COUNTROWS to be your Slicer Column
  • And your Outer CALCULATE to be your Table Name.

Conclusion

You can see that by counting your Slicer how dynamic you can make your data.

You can download the PBIX file with the example data here (Item count on Slicer sheet): UnPivot Other Columns.pbix

BI-NSIGHT – Power BI (Mobile App Update – Android Tablets, Navigation Preview, AMA, Driving Power BI Adoption in your Organisation) – Excel (Get & Transform Update)

It does appear that as we approach the festive season, the Microsoft team are still full steam ahead, which is great for myself and the Data Analytics community.

Power BI – Mobile App update for Android Tablets

As per their blog post, it is great to see that there now is an App for the Android tablets, whilst this has been around for quite some time on the iPad tables, it has now come to Android.

It is great to see and you can find the blog post here: Now in preview: the Power BI you love on your Android tablet

Power BI – Navigation Preview

I have to say that I have already enabled the preview features, and whilst it did take a little time to get used to, it is definitely a step in the right direction.

It makes it easier to navigate when you have a lot of reports, dashboards and workspaces. As well as less clicks to get to the options that you want to use.

You can find more details here: Announcing the Power BI Navigation Preview

Power BI – AMA (Ask Microsoft Anything)

Depending on when you read this, you might be a little late, but it is great concept where you can ask Microsoft anything relating to Power BI.

I have no doubt that there will be some tough questions posed, but also a great wealth of information into Power BI.

You can see the dates and times above.

You can find the blog post here: Announcing the Power BI Ask Microsoft Anything

Power BI – Driving Power BI Adoption in your Organisation

This is a great blog post in which Microsoft gives an example of how they have used and enabled the business into data driven decisions using Power BI and how to get it adopted within Microsoft.

The really interesting part I think is that Microsoft is a large multi-country company, so if they can adopt Power BI in such a large scale, then it should be achievable with any other companies.

And not only that, but because Power BI is their own product I often like to think that because they build it, they might not use it as much as an external organisation, but they are which is great to see.

I would recommend reading through this if you are looking to get your organisation into Power BI: Driving Power BI adoption in your organization – Learn how Microsoft does this at scale

Excel – Get & Transform Update

It is great to see that there have been so many ypdates to the Get & Transform for Excel. I often feel like the Excel people do get left behind due to the sheer pace from the Power BI Team.

All of the updates are shown below

  • Web Connector—UX support for specifying HTTP Request Headers.
  • OData Connector—support for “Select Related Tables” option.
  • Oracle Connector—improved Navigator preview performance.
  • SAP HANA Connector—enhancements to parameter input UX.
  • Query Dependencies view from Query Editor.
  • Query Editor ribbon support for scalar values.
  • Add custom column based on function invocation.
  • Expand & Aggregate columns provide support for “Load More” values.
  • Convert table column to a list—new transformation.
  • Select as you type in drop-down menus.

You can read their blog post to get more details: November 2016 updates for Get & Transform in Excel 2016 and the Power Query add-in

Power BI – Using Parameters in Calculated Measures (Making Calculated Measures Dynamic based on Parameter)

What this is going to explain below is how I use a parameter that a user has entered to make a Dynamic Calculated Measure based on the Parameter entered.

Example Scenario

  • In my model I have got Parameters for the Fiscal Start Year
  • So I want to create a calculated Measure that will get me the values for 4th Year going forward
    • So what we are looking to calculate is the following, which is the Value for 2015-16
  • And then if we change the Parameters for the Fiscal Start Year as shown below
  • So I want to create a Calculated Measure that will get me the values for 4th Year going forward
    • So what we are looking to calculate is the following, which is the Value for 2017-18
  • But using the same calculation

Getting the Parameter into a table

In the steps below I am going to explain how to get our Parameter Value for the Fiscal Start Month into a table in the Query Editor

  • Go into the Query Editor
  • Then click on New Source, and select Blank Query
  • Now in my Example I name the Query “Parameter – Fiscal Start Year”
  • Next I clicked on Advanced Editor
  • I then put in the following M Code

    let

    Source = #table({“Fiscal Start Year Number”},{{#”Fiscal Start Year”}})

    in

    Source

    • As you can see above I created a table with the Column Name “Fiscal Start Year Number” highlighted in PURPLE
    • And then defined the column to have the Parameter called #”Fiscal Start Year”
      highlighted in LIGHT BLUE
  • This then results in the following table as shown below.
  • What I then did was to use the standard Query Editor Functions and changed it to the Data Type of Whole Number
  • NOTE: This is so that I can then use it to go backwards and forwards for my dynamic calculated measure.
  • The final step was to load it into my Power BI Desktop Model

Creating the Dynamic Calculated Measure

Next I will explain how I created my dynamic calculated measure, which will change based on what the Fiscal Start Date Parameter that has been selected.

  • Below is my Dynamic Calculated Measure syntax with the explanation what I did afterwards.

    Total Value for 3rd Year =

    CALCULATE (

    [Total Value],

    FILTER (

    ‘Budget Data without New Year’,

    ‘Budget Data without New Year'[Fiscal Year Number]

    = VALUES ( ‘Parameter – Fiscal Start Year'[Fiscal Start Year Number] ) + 3

    )

    )

    • What I have done is to name and start my Calculated Measure and put in the filter.
    • The part where the magic happens in the Filter
      • In here is where I specify that I want to look at the ‘Budget Data without New Year'[Fiscal Year Number] and compare that with the VALUES from my parameter ‘Parameter – Fiscal Start Year'[Fiscal Start Year Number]
      • And then I always want to go forward by 3 to get the 4th year going forward
  • So once this has run I should get the following as shown previously for Fiscal Start Year Parameter 2012
    • And I get the following below.
  • So if I change the Fiscal Start Year Parameter to 2014 once this has run I should get the following as shown previously.
    • And I get the following below.

Conclusion

By using Parameters and putting it into a table means that this can then be used to dynamically create other calculated measures.

You can download the PBIX file with the example data here: UnPivot Other Columns.pbix