I had a requirement where I needed to have the capability to set the filter once on a report for the current month and then it dynamically move as each month progresses.
I will show how I completed this in the steps below.
NOTE: As with almost all Power BI Models, this is going to be leveraging off my Date table that I created. If you want to know how to create your own Date table you can follow my blog post Power BI – How to Easily Create Dynamic Date Table/Dimension with Fiscal Attributes using Power Query
Getting the Current Year-Month in the Query Editor
The first thing that I needed to do was to create a new column in the query editor which will show what the current month is.
-
In order to this it involved first create a column which had a combination of the Year and Month Number.
- NOTE: This was so that I was selecting the current month.
-
I went into the Query Editor and created the following column as shown below for the Year and Month Number
-
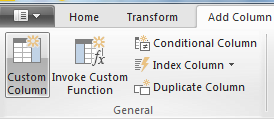
I clicked on Add Column in the ribbon then Custom Column
-
Below is the syntax that I put in the Custom column formula
Number.ToText([Calendar Year]) & “-” & Number.ToText( [Calendar Month Number])
- What I had to do above is because the [Calendar Year] and [Calendar Month Number] are formatted as Numbers, I had to change this to Text with the Number.ToText highlighted in GREEN above.
- As you can see above, what I did here was I combined the Calendar Year and Calendar Month Number, so that the output was as sown below.
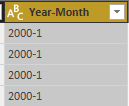
-
-
Next is where I created another column which will be the current Year-Month.
-
I clicked on Add Column in the ribbon then Custom Column
-
Below is the syntax that I put in the Custom column formula
Number.ToText(Date.Year(DateTimeZone.SwitchZone(DateTimeZone.FixedLocalNow(),10))) & “-” & Number.ToText(Date.Month(DateTimeZone.SwitchZone(DateTimeZone.FixedLocalNow(),10)))
- To explain this best was for me to explain this from the inside out, so starting with the DateTimeZone.FixedLocalNow() is where it is getting your Local Data for the time zone that you are in. This is highlighted in ORANGE.
-
Next I put in the DateTimeZone.SwitchZone() and set this to 10.
- NOTE: The reason that I did this, is so that when this Power BI Desktop file gets uploaded to the Power BI Service, it will still show the correct time for my current time zone. This was highlighted in LIGHT BLUE
- Next what I did to get the Year, I used the Date.Year function which will just return the Year, for what is currently being requested, and in this case is the current date. And is highlighted in PURPLE
- Next what I did to get the Year, I used the Date.Month function which will just return the Month, for what is currently being requested, and in this case is the current date. And is highlighted in GREY
- And finally I had to do above is because the Date.Year and Date.Month
automatically get formatted as Numbers, I had to change this to Text with the Number.ToText highlighted in GREEN above.
- So as you can see below for my current date (15 Feb 2017) I got the following in my column called Current Year Month which should be 2017-2
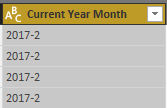
-

Creating the Comparison Column and required output
In the next steps below I will show how I now easily created the comparison column with the required output.
- As with the example I wanted to get the Current Month.
-
I went into the Query Editor and created the following column as shown below for the Year and Month Number
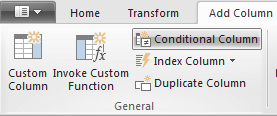
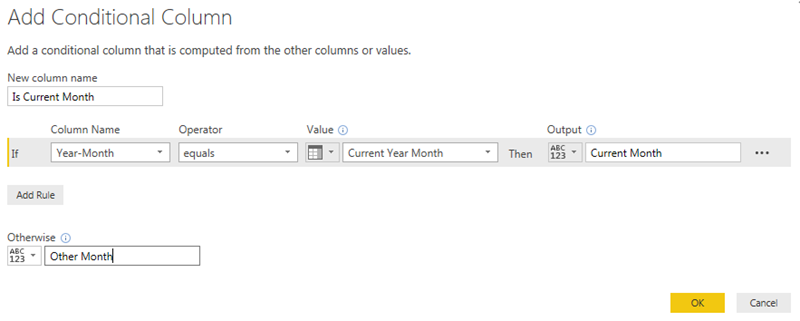
- I clicked on Add Column in the ribbon then Conditional Column
-
I then put in the following conditions as shown below.
- As you can see above I used both of the columns [Year-Month] and [Current Year Month] to evaluate my condition.
-
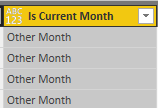
The result of the conditional column is shown below.
-
And what I did to confirm that it was working correctly is I filtered my [Is Current Month] column to “Current Month“, so that I should only see the Dates for Feb 2017, which is what I saw as shown below.
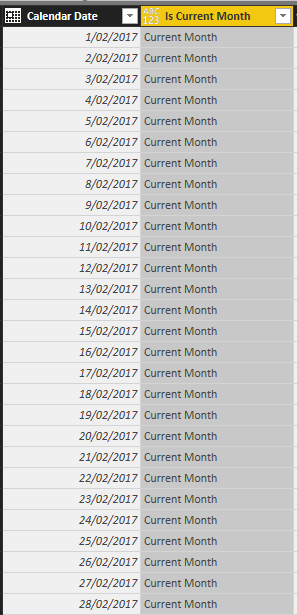
- NOTE: I did remove this filter before loading the data into my Power BI Model.
Putting the page filters in place for current month
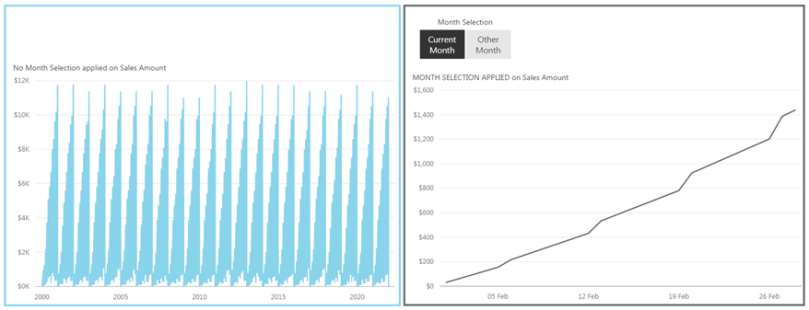
So the final step I did was to now put in the page filter, or even using a slicer to filter the data to always show the current month.
- So as you can see below what I did was I created a Month Selection slicer and applied the Interaction Only to the chart on the right hand side.
- Whilst the chart on the left hand side I set the interaction to None
Additional column filters for different periods
Below are some additional column filters, so that you can use them for your own periods.
In order to do this, you will use the code below and use it when creating the column called [Current Year Month] or new column.
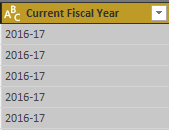
Current Fiscal Year
Number.ToText(Date.Year(DateTimeZone.SwitchZone(DateTimeZone.FixedLocalNow(),10))-1) & “-” & Text.End(Number.ToText(Date.Year(DateTimeZone.SwitchZone(DateTimeZone.FixedLocalNow(),10))),2)
-
NOTE: The above has the following output.
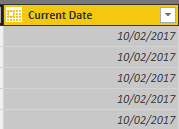
Current Date
- Date.From(DateTimeZone.SwitchZone(DateTimeZone.FixedLocalNow(),10))
-
NOTE: The above has the following output.
Conclusion
So as you can see from the final output, by creating the columns in the query editor and then using the output as a slicer in the above example or as a page filter, you can then apply this to your data to always be current.
One thing that you need to be made aware of, is that in order for this to work correctly, you will have to refresh your data based on the frequency of your filter. As with the above example it was Monthly, so I would have to ensure that my data was updated monthly.
Finally you can download a copy of the above file here: which has got the additional columns also: Filtering Reports to Current Month.pbix

[…] über Power BI – Getting your report to always filter this month’s data dynamically — Gilbert Quevau… […]